Enhanced Debugging: Throttle Individual Network Requests in Chrome DevTools
Discover how Chrome DevTools now supports individual request throttling, allowing developers to precisely simulate slow network conditions for specific resources. This granular control enhances debugging and performance analysis without affecting the entire page.
Chrome DevTools introduces the Request conditions tab, enabling developers to block specific URLs or apply custom network throttling profiles to individual resources.
Overview
Previously, Chrome DevTools offered global network throttling and the ability to block specific requests entirely. However, isolating the impact of individual slow resources—such as a high-latency third-party API or a large image loading over a poor connection—proved challenging, often requiring the entire page to be slowed down. With the release of Chrome 144, DevTools now supports Individual Request Throttling.
This powerful enhancement allows developers to apply precise network conditions to selected individual requests, complementing the existing blocking capabilities. These functionalities have been integrated into a new, more comprehensive Request conditions drawer, replacing the former 'Network request blocking' drawer. This improved precision facilitates faster debugging by selectively slowing down only the relevant resources, rather than the entire website.
Throttle or Block a Request
To block or throttle a specific resource, right-click any request within the Network panel. From the context menu, select either Block request or Throttle request, choosing to apply the rule to the exact URL or the entire domain. This action automatically opens the Request conditions drawer, creates a new rule for the selected entry, and instantly applies the chosen network constraints.
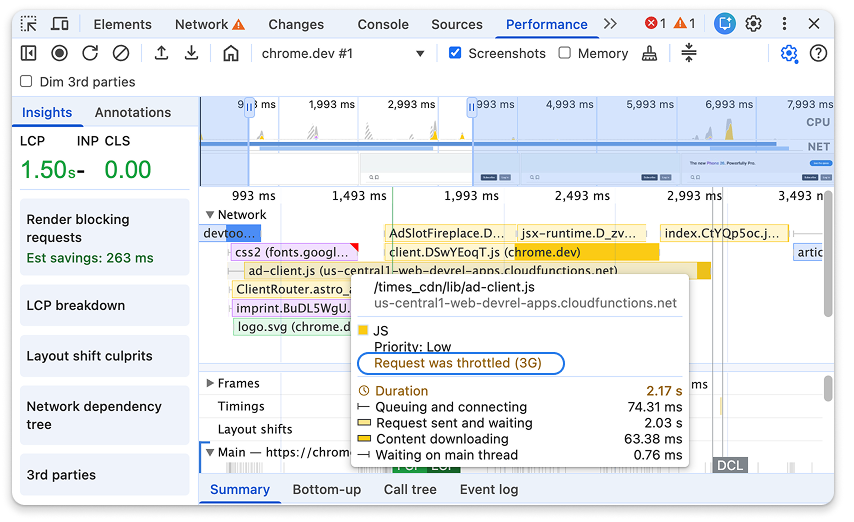
Note: When requests are being modified, a warning icon will appear on the Network panel tab. Hovering over this icon provides a reminder: "Request was throttled." The same notification is also visible in the Performance panel's network track.
Request Conditions Drawer
The new Request conditions drawer provides granular control, allowing you to specify which requests are affected and the extent of the throttling.
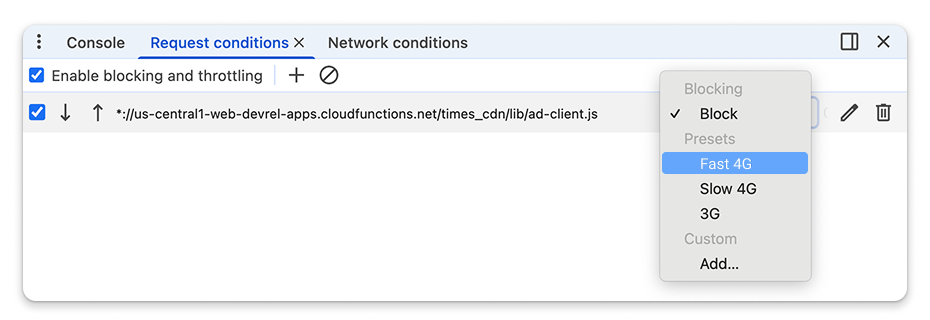
Developers can customize throttling settings by choosing from standard presets (e.g., Slow 3G) or defining custom profiles. URL patterns can also be edited using wildcards (*) to apply conditions to dynamic resources or groups of requests. If a request matches multiple patterns, DevTools prioritizes and applies the first rule encountered. Users can manage this precedence by using the arrow buttons within the drawer to reposition high-priority rules to the top of the list.
Understand Which Requests Are Throttled or Blocked
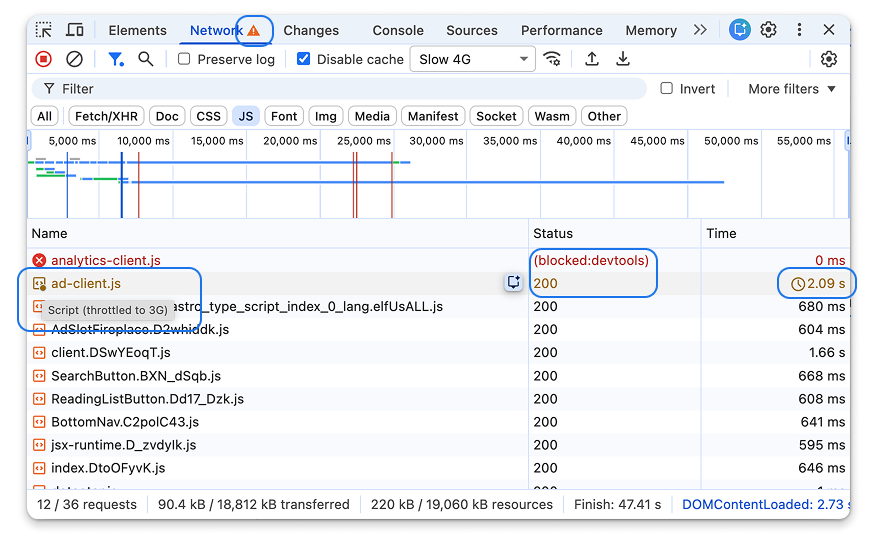
It's crucial for developers to differentiate between requests that are inherently slow and those artificially throttled by DevTools. Upon reloading the page, the newly defined throttling rules are applied, and affected requests are clearly identifiable in the Network panel:
- Blocked requests appear in red, with their status displaying
(blocked:devtools)in the Status column. - Throttled requests are indicated in yellow or gold and feature a clock icon in the Time column. Hovering over this icon reveals the exact network condition applied, a detail also visible in the Timings sub-panel.
Throttling requests can significantly impact a page's perceived performance. When recording a performance profile, hovering over a request in the Network track will display a tooltip providing detailed information about the applied network conditions.