Getting Started with Streamlit: Learn Widgets, Layouts, and Caching
Discover how to build interactive web applications purely with Python using Streamlit. This guide covers core widgets, layout options, and caching strategies to create fast, efficient, and responsive data applications, eliminating the need for HTML or JavaScript.
In this tutorial, you will learn to build your first interactive web application using Streamlit—entirely in pure Python, without requiring HTML or JavaScript. The guide begins by explaining how Streamlit transforms a simple script into a reactive application, then delves into its core widgets and layout options, concluding with the integration of caching to ensure your app is fast, efficient, and production-ready.

Introduction
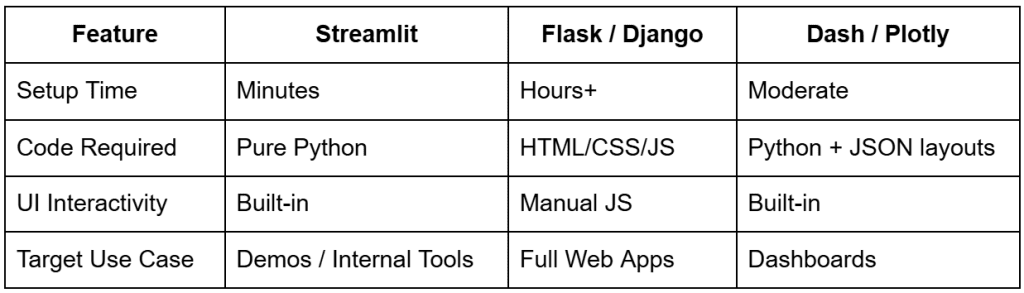
If you've ever developed a machine learning model or data pipeline and wished to showcase it in action, you've likely encountered the common challenge of knowing Python but not web development. Traditional frameworks like Flask or Django are powerful but necessitate managing routes, templates, HTML, CSS, and JavaScript—all before your core model even runs. This complexity often delays or derails demonstrations.
Streamlit completely transforms this scenario. It converts your Python scripts into interactive web applications within minutes, requiring no front-end code, complex configuration, or deployment hurdles. This allows you to concentrate solely on the application's logic, visuals, and results, while Streamlit adeptly handles the user interface (UI), reactivity, and state management behind the scenes.
This initial lesson will guide you from a blank file to a functional Streamlit app that responds to user input, displays data, and even caches computationally intensive operations for enhanced speed. You will also gain an understanding of Streamlit’s underlying execution model, which becomes highly intuitive once its rerun cycle is grasped.
By the end of this tutorial, you will not only know how to write a Streamlit app but also understand why it offers such rapid development and seamlessly integrates into your existing Python workflow.

What Is Streamlit?
Simply put, Streamlit is a Python framework that instantly converts scripts into interactive web applications—without requiring HTML, CSS, or JavaScript. Each Streamlit command (st.*) adds a new UI element to the page, such as a slider, a chart, a data frame, or even an entire layout section. You write Python code, and Streamlit manages its rendering in the browser.
This simplicity has made Streamlit a preferred tool for data scientists and ML engineers, bridging the gap between experimentation and demonstration. Instead of deferring UI development, you can visualize and present your work immediately.
Why Developers Love Streamlit
- Simplicity: Build complete interfaces using pure Python; no HTML templates or JavaScript are necessary.
- Reactivity: Streamlit automatically reruns your script every time a user interacts with a widget (e.g., adjusting a slider or typing text).
- Integration: Works seamlessly with popular Python libraries such as pandas, NumPy, matplotlib, Plotly, Altair, and scikit-learn.
- Speed: Save your file, and the browser updates instantly, eliminating the need for server restarts or manual refreshes.
- Deploy Anywhere: From local demonstrations to Streamlit Cloud, AWS, or Docker containers, Streamlit applications can run wherever Python is supported.
Real-World Example
Imagine you have trained a model to predict customer churn. With Streamlit, you can construct a straightforward dashboard where teammates can upload customer CSVs, adjust thresholds, and instantly visualize churn probabilities—all from your Python environment. This approach requires no web server setup or frontend build tools, allowing you to create an interactive demo in minutes, not weeks.
Under the Hood
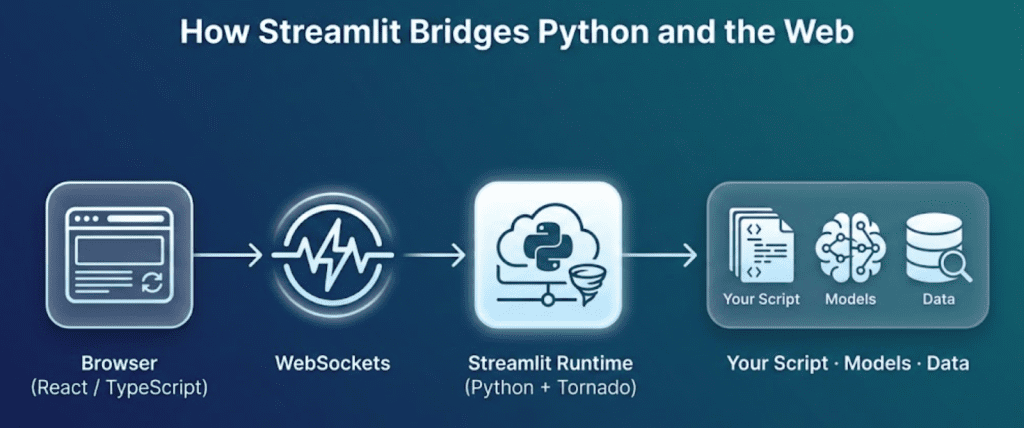
When a Streamlit app is launched, two primary components are initiated:
- Backend: A lightweight Tornado-based Python server executes your code, tracks widget states, and streams results to the frontend.
- Frontend: A React + TypeScript application running in your browser renders the visual elements and transmits widget updates via a WebSocket connection.
Every user action, such as adjusting a slider, sends a message to the backend. The backend then re-executes your script from top-to-bottom with the updated values. This new “frame” is subsequently re-rendered in the browser, providing Streamlit its characteristic reactive feel—Python behaving like a web app.
Pro Tip: Consider Streamlit as "a Python notebook that lives in your browser, with interactivity built in."
How Streamlit Works (Under the Hood)
While your first Streamlit app might resemble a conventional website, its underlying mechanics differ significantly from Flask, Django, or other traditional web frameworks. Instead of managing routes and templates, Streamlit re-executes your Python script from top to bottom every time a user interacts with it.
This rerun model is what makes Streamlit reactive and straightforward to understand.
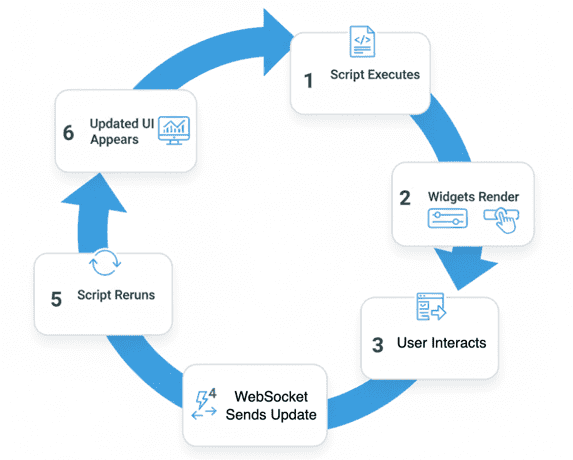
Step-by-Step Execution Cycle
Let’s break it down:
- Startup: You launch your app using
streamlit run lesson1_main.py. Streamlit starts a local Python server (typically athttp://localhost:8501) and opens your default browser. - Initial Render: The script (
lesson1_main.py) executes once, line by line. Each Streamlit command (e.g.,st.title(),st.slider(), orst.write()) contributes a new element to an internal “page plan” that defines the app’s appearance. - Widget State Tracking: Streamlit automatically monitors widget values (e.g., the number selected on a slider or text entered in a box). Each browser session maintains its own distinct state.
- Interaction Event: When a user modifies an element (moves a slider, clicks a button, or uploads a file), the frontend transmits the updated widget state to the backend over a WebSocket connection.
- Rerun Trigger: The backend re-executes your Python script from the top, utilizing the new widget state. Crucially, your script operates not as a persistent loop but as a function of the current inputs.
- Efficient Re-render: Streamlit’s runtime compares the new “page plan” with the previous one, updating only the elements that have changed. The user experience is consequently instantaneous and seamless.
Why This Model Works
This approach might initially seem inefficient (rerunning the script on every interaction?), but it is, in fact, elegant and predictable. You are freed from concerns about asynchronous callbacks, thread locks, or manual state management—Streamlit handles these complexities for you.
By keeping your script purely declarative, you ensure that each interaction results in a consistent UI derived solely from the current inputs. When combined with caching (using @st.cache_data or @st.cache_resource), this model also achieves exceptional performance.
Mental Model
Consider your Streamlit app as: A Python function that translates inputs (widget state) into outputs (UI elements), re-evaluated whenever inputs change.
Once this model is internalized, debugging and expanding your application become significantly simpler.
Configuring Your Development Environment
To follow this guide, you need Streamlit and a few supporting libraries installed. Streamlit is easily installable via pip and is compatible with all major platforms.
pip install "streamlit>=1.38,<2" "pandas>=2.2,<3"
After installation, verify the setup:
python -c "import streamlit, pandas; print(streamlit.__version__, pandas.__version__)"
You should see version numbers displayed in your terminal, confirming that your environment is ready.
Project Structure
First, let’s examine our project directory structure. Retrieve the source code archive and example data. After unzipping the folder, you should observe the following layout:
streamlit_project/
├── lesson1_main.py
├── lesson2_main.py
├── lesson3_main.py
├── pyimagesearch/
│   ├── __init__.py
│   ├── config.py
│   ├── data_loader.py
│   ├── visualization.py
│   └── snowflake_utils.py
├── data/
│   └── iris_sample.csv
├── .streamlit/
│   ├── config.toml
│   └── secrets.toml
├── requirements.txt
└── README.md
Here’s a brief explanation of each component:
lesson1_main.py: The Streamlit app developed in this lesson, introducing widgets, layout, and caching.lesson2_main.py: Used in Lesson 2 for file uploads, data exploration, and charting.lesson3_main.py: The final app integrating Streamlit with Snowflake for live warehouse data.pyimagesearch/: A lightweight Python package containing shared helper modules:config.py: Centralized app configuration and settings.data_loader.py: Efficiently loads sample datasets (e.g., Iris) using caching.visualization.py: Contains reusable chart and plotting utilities.snowflake_utils.py: Manages Snowflake connections and query execution (utilized in Lesson 3).
data/iris_sample.csv: The classic Iris dataset, employed for initial data visualization examples..streamlit/config.toml: An optional file for customizing your app’s theming or layout..streamlit/secrets.toml: To be used in Lesson 3 for securely storing Snowflake credentials.requirements.txt: Lists all dependencies for your Streamlit environment.README.md: Provides an overview of the mini-course.
Understanding the Helper Modules (config.py and data_loader.py)
Before coding our first app, let's clarify the functionality behind importing:
from pyimagesearch import settings, load_iris_sample
These are derived from two concise utility files within the pyimagesearch/ package. While seemingly simple now, they are crucial for maintaining modular and scalable code across all lessons.
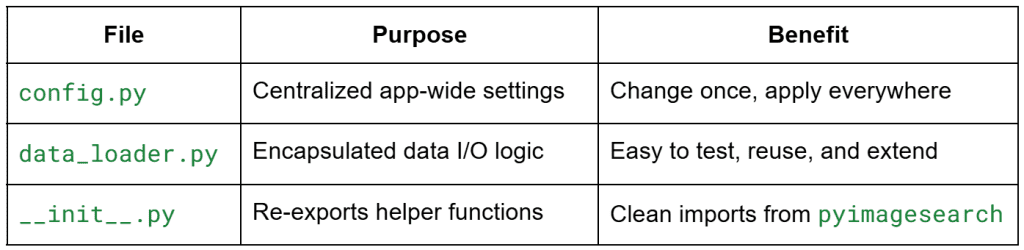
config.py: Centralized Settings
This file defines a small Settings dataclass to store global configuration values. For Lesson 1, only one field is immediately relevant:
default_sample_path: str = os.path.join("data", "iris_sample.csv")
This single variable ensures that every script knows the location of the Iris dataset. Should you relocate your data folder later, you only need to update this path once in this file, rather than across the entire project.
The other fields (e.g., snowflake_user or snowflake_account) are placeholders for Lesson 3, where you will integrate a live Snowflake data warehouse. Currently, they are initialized as None.
When you import settings, you are simply accessing a frozen instance of this dataclass—a straightforward, read-only global configuration object.
data_loader.py: Cached CSV Loader
Next, consider the data loader:
@lru_cache(maxsize=1)
def load_iris_sample(path: str) -> pd.DataFrame:
    return pd.read_csv(path)
This is a minimal wrapper around pandas.read_csv(), featuring one significant addition: @lru_cache(maxsize=1). This cache ensures that even if Streamlit reruns your script multiple times (which it will), the CSV file is read only once per session. It serves as a pedagogical example of what you will later achieve with @st.cache_data when loading larger or remote datasets.
Why This Structure Matters
While this design might appear overly formal for a small application, it reflects the organizational patterns of production-grade Streamlit projects, facilitating scalability from a basic demo to a maintainable internal dashboard.
Your First Streamlit App: Hello + Core Widgets
Let's begin by building a simple "Hello Streamlit" app that introduces essential UI primitives: text, inputs, and interactive widgets.
Create a new file named lesson1_main.py within your project directory and add the following code:
# lesson1_main.py
import streamlit as st
from pyimagesearch import settings, load_iris_sample
import time
st.set_page_config(page_title="Lesson 1 - Getting Started", layout="centered")
st.title("🚀 Lesson 1: Getting Started with Streamlit")
st.write(
"Intro to Streamlit primitives: text, widgets, layout, state via reruns, and a caching preview."
)
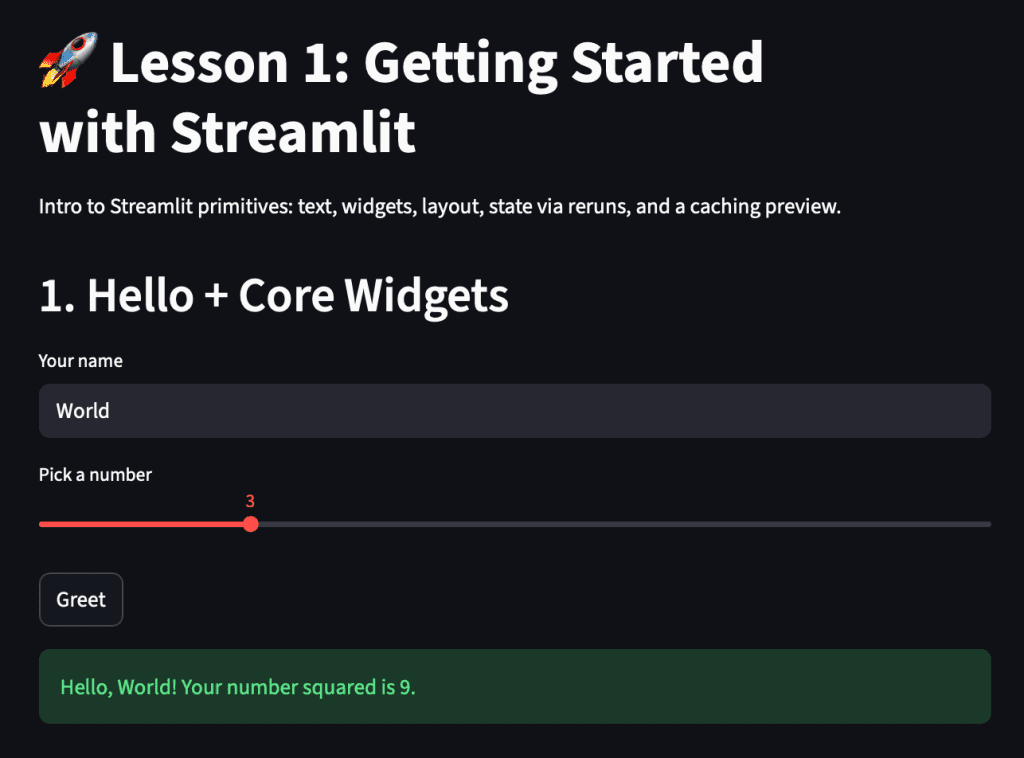
st.header("1. Hello + Core Widgets")
name = st.text_input("Your name", "World")
favorite_num = st.slider("Pick a number", 1, 10, 3)
if st.button("Greet"):
st.success(f"Hello, {name or 'friend'}! Your number squared is {favorite_num ** 2}.")
Now, launch the app from your terminal:
streamlit run lesson1_main.py
Once the app opens in your browser (by default at http://localhost:8501), you will see a text input, a slider, and a button that responds interactively when clicked.
How It Works
Let’s break it down step-by-step:
st.set_page_config: Defines global app settings, such as title and layout, before any elements are rendered.st.titleandst.write: Your simplest text outputs, supporting headers, Markdown, and general content.st.text_inputandst.slider: Return user-controlled values each time the script reruns.st.button: Acts as a transient trigger, returningTrueonly during the exact rerun when it is clicked.st.success: Displays a styled success message dynamically based on user input.
Each time you enter text, adjust the slider, or press the button, Streamlit automatically reruns the entire script from top to bottom. However, widget values persist across reruns, enabling your app to behave reactively while maintaining a stateless code structure.
Expanding the App: Dataset Preview + Widget Playground
Having explored basic widgets, let’s extend our app to incorporate data interaction and additional UI elements.
Update your lesson1_main.py with the following code:
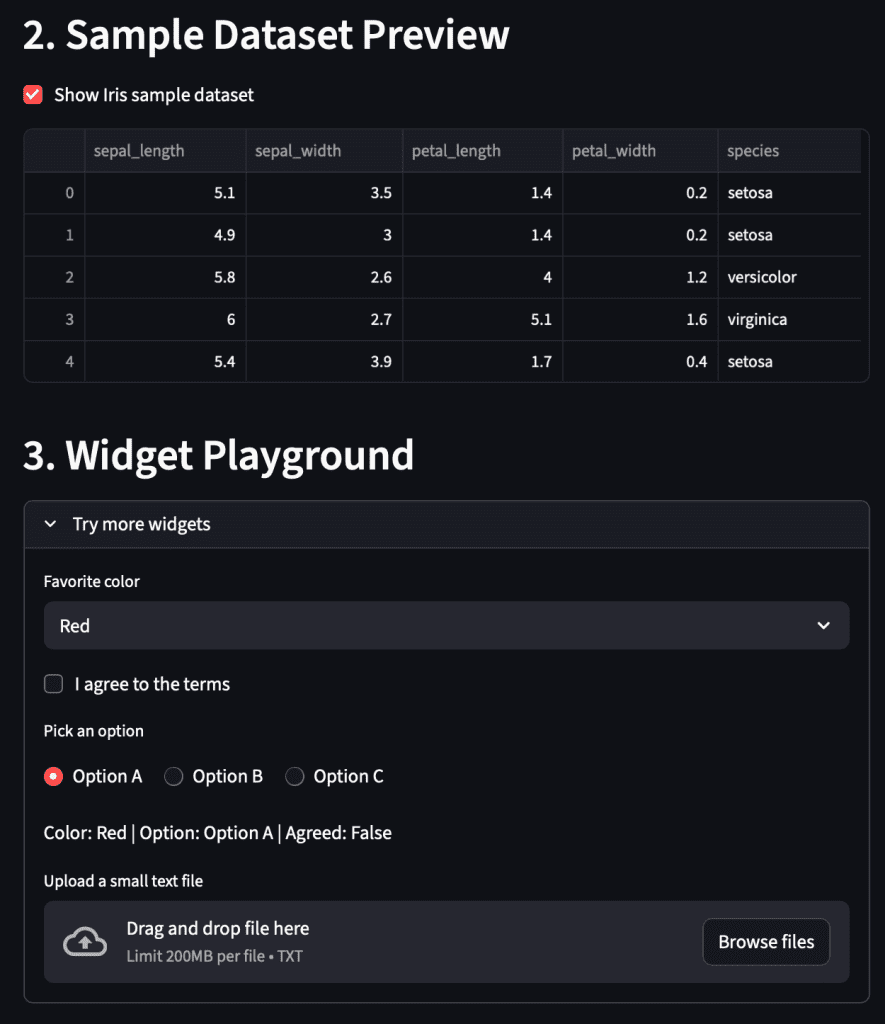
st.header("2. Sample Dataset Preview")

show_df = st.checkbox("Show Iris sample dataset", value=True)
if show_df:
    df = load_iris_sample(settings.default_sample_path)
    st.dataframe(df.head())
else:
    df = None  # type: ignore

st.header("3. Widget Playground")
with st.expander("Try more widgets", expanded=False):
    color = st.selectbox("Favorite color", ["Red", "Green", "Blue"])
    agree = st.checkbox("I agree to the terms")
    option = st.radio("Pick an option", ["Option A", "Option B", "Option C"], horizontal=True)
    st.write(f"Color: {color} | Option: {option} | Agreed: {agree}")

    uploaded = st.file_uploader("Upload a small text file", type=["txt"])
    if uploaded:
        st.code(uploaded.read().decode("utf-8")[:500])
What’s Happening Here
Let’s break down the new sections:
- Dataset preview: The Iris dataset is stored in
data/iris_sample.csv.load_iris_sample()(defined inpyimagesearch/data_loader.py) usespandas.read_csv()wrapped with@lru_cache(maxsize=1). This ensures the file is read from disk only once; subsequent reruns reuse the cached DataFrame, maintaining app responsiveness. - Checkbox toggle: When "Show Iris sample dataset" is checked, the DataFrame appears; unchecking it hides the data. This demonstrates conditional rendering—a straightforward method for creating dynamic applications.
- Expander widget group: The
st.expanderfunctions as a collapsible section, ideal for organizing optional controls. Inside, you experiment withselectbox,checkbox, andradiowidgets. Thest.file_uploaderallows for uploading small text files. Upon upload, the app reads, decodes, and displays the first 500 characters of the content.
Collectively, these features illustrate how Streamlit maintains an interactive and stateful application, even though your script executes from top to bottom on each user action.
Structuring Your Layout: Columns + Metrics
Streamlit simplifies the visual organization of information using columns, sidebars, and metrics—all without requiring HTML or CSS expertise.
Let’s add a basic layout section that displays dynamic statistics derived from your Iris dataset and user inputs. Append this block to your existing script:
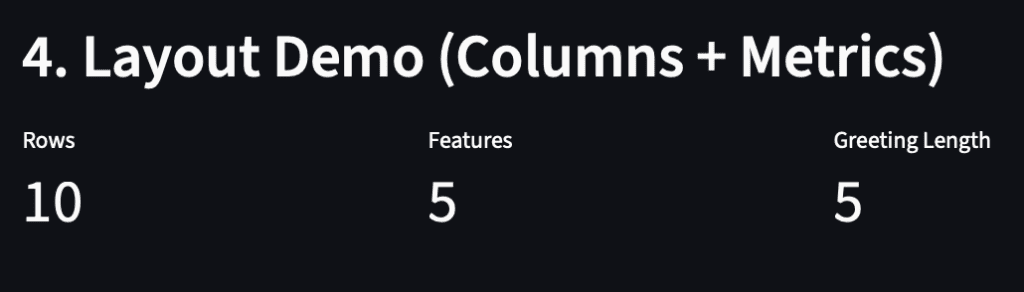
st.header("4. Layout Demo (Columns + Metrics)")

col1, col2, col3 = st.columns(3)

with col1:
    st.metric("Rows", len(df) if df is not None else 0)
with col2:
    st.metric("Features", 5 if df is not None else 0)
with col3:
    st.metric("Greeting Length", len(name))
Understanding Columns and Metrics
st.columns(3): Divides the page into three equal-width containers. Each container (col1,col2,col3) functions as a distinct layout context. Widgets and text added within each context appear side-by-side rather than stacked vertically.st.metric(label, value): Displays a clean, compact key-value card, commonly used for key performance indicators (e.g., totals, averages, growth rates). You can also include a third "delta" argument (e.g.,st.metric("Sales", 100, "+5%")) to illustrate performance trends, which will be explored further in Lesson 2 when visualizing data.
In this example:
- The
Rowscount indicates the number of records in the Iris DataFrame. Featuresrepresents the number of columns (hardcoded to5here).Greeting Lengthdemonstrates how a small metric can be dynamically computed from user input (len(name)).
This concise summary layout gives your app a dashboard-like appearance, perfect for presenting small insights without cluttering the interface.
Speeding Things Up with Caching (@st.cache_data)
Every time a user interacts with a widget, Streamlit reruns the entire script from top to bottom. While this ensures reactivity, it can lead to unnecessary repetition of computationally intensive operations.
To address this, Streamlit offers a lightweight caching system implemented via decorators such as @st.cache_data.
Add this final block to your script:
st.header("5. Caching Preview (@st.cache_data)")
st.caption("Caching avoids recomputing expensive functions on every rerun.")

@st.cache_data
def expensive_double(n: int) -> int:
    time.sleep(1.5)  # simulate expensive work
    return n * 2

val = st.slider("Value to double (cached)", 1, 20, 4, key="cache_slider")

start = time.time()
result = expensive_double(val)
elapsed = time.time() - start

st.write(f"Result: {result} (elapsed this run: {elapsed:.2f}s - faster after first call per value)")

How Caching Works
When you decorate a function with @st.cache_data, Streamlit stores its inputs and outputs. If the same input is encountered again, Streamlit skips re-execution and immediately returns the cached result.
Here’s a breakdown of this example:
- You move the slider to a new number, prompting Streamlit to rerun the script.
- The
expensive_double()function checks if that number (n) has been previously computed. - If not, it pauses for 1.5 seconds (simulating a costly task) and saves the result.
- The next time you select the same number, the function returns instantly, without delay or recomputation.
Caching is essential when your application interacts with databases or performs inference on machine learning models. By preventing redundant work, it ensures a responsive user experience and efficient backend operations.
Summary
In this foundational lesson, you gained a comprehensive understanding of Streamlit: its nature, its reactive rerun model, and how it transforms a simple Python script into an interactive web application without relying on HTML, CSS, or JavaScript.
You also:
- Established a clean project structure with reusable helper modules (
config.py,data_loader.py). - Explored Streamlit’s core widgets (
st.text_input,st.slider,st.button, etc.). - Practiced fundamental layout patterns using columns.
- Understood how
@st.cache_dataprevents repeated, expensive computations. - Observed how each interaction triggers a top-to-bottom rerun while Streamlit automatically preserves widget state.
- Learned early best practices for modularity, readability, and caching.
In essence, you now possess the practical knowledge to transition from a static Python script to a live, reactive UI. Lesson 2 will further expand on these concepts, introducing navigation, file uploads, visualizations, and real-time data exploration.