Grab's Mac Cloud Exit: Enhanced CI/CD Performance and $2.4M Savings
Grab migrated its macOS CI/CD infrastructure to a Southeast Asian colocation cluster, boosting build performance by 20-40% and saving $2.4M. A strategic move enhancing engineering efficiency.
Introduction
To optimize our continuous integration and delivery (CI/CD) workflows, we embarked on a strategic initiative to relocate our infrastructure from a cloud vendor in the US to a colocation cluster within Southeast Asia. This move positions our infrastructure closer to our Git server, dramatically improving macOS build performance by minimizing network latency associated with distant data centers. By bringing our operations closer to home, we've not only accelerated CI/CD job completion times but also significantly reduced operational costs.
Join us as we explore the journey of our Mac Cloud Exit and the substantial enhancements it has brought to our engineering workflows.
Our macOS CI/CD infrastructure has undergone significant evolution, growing from a single physical Mac Pro in our office to a cluster of 250 Mac minis, which are fully utilized during peak hours. This transformation involved multiple stages, and this blog post will focus on the key areas highlighted in the following diagram.
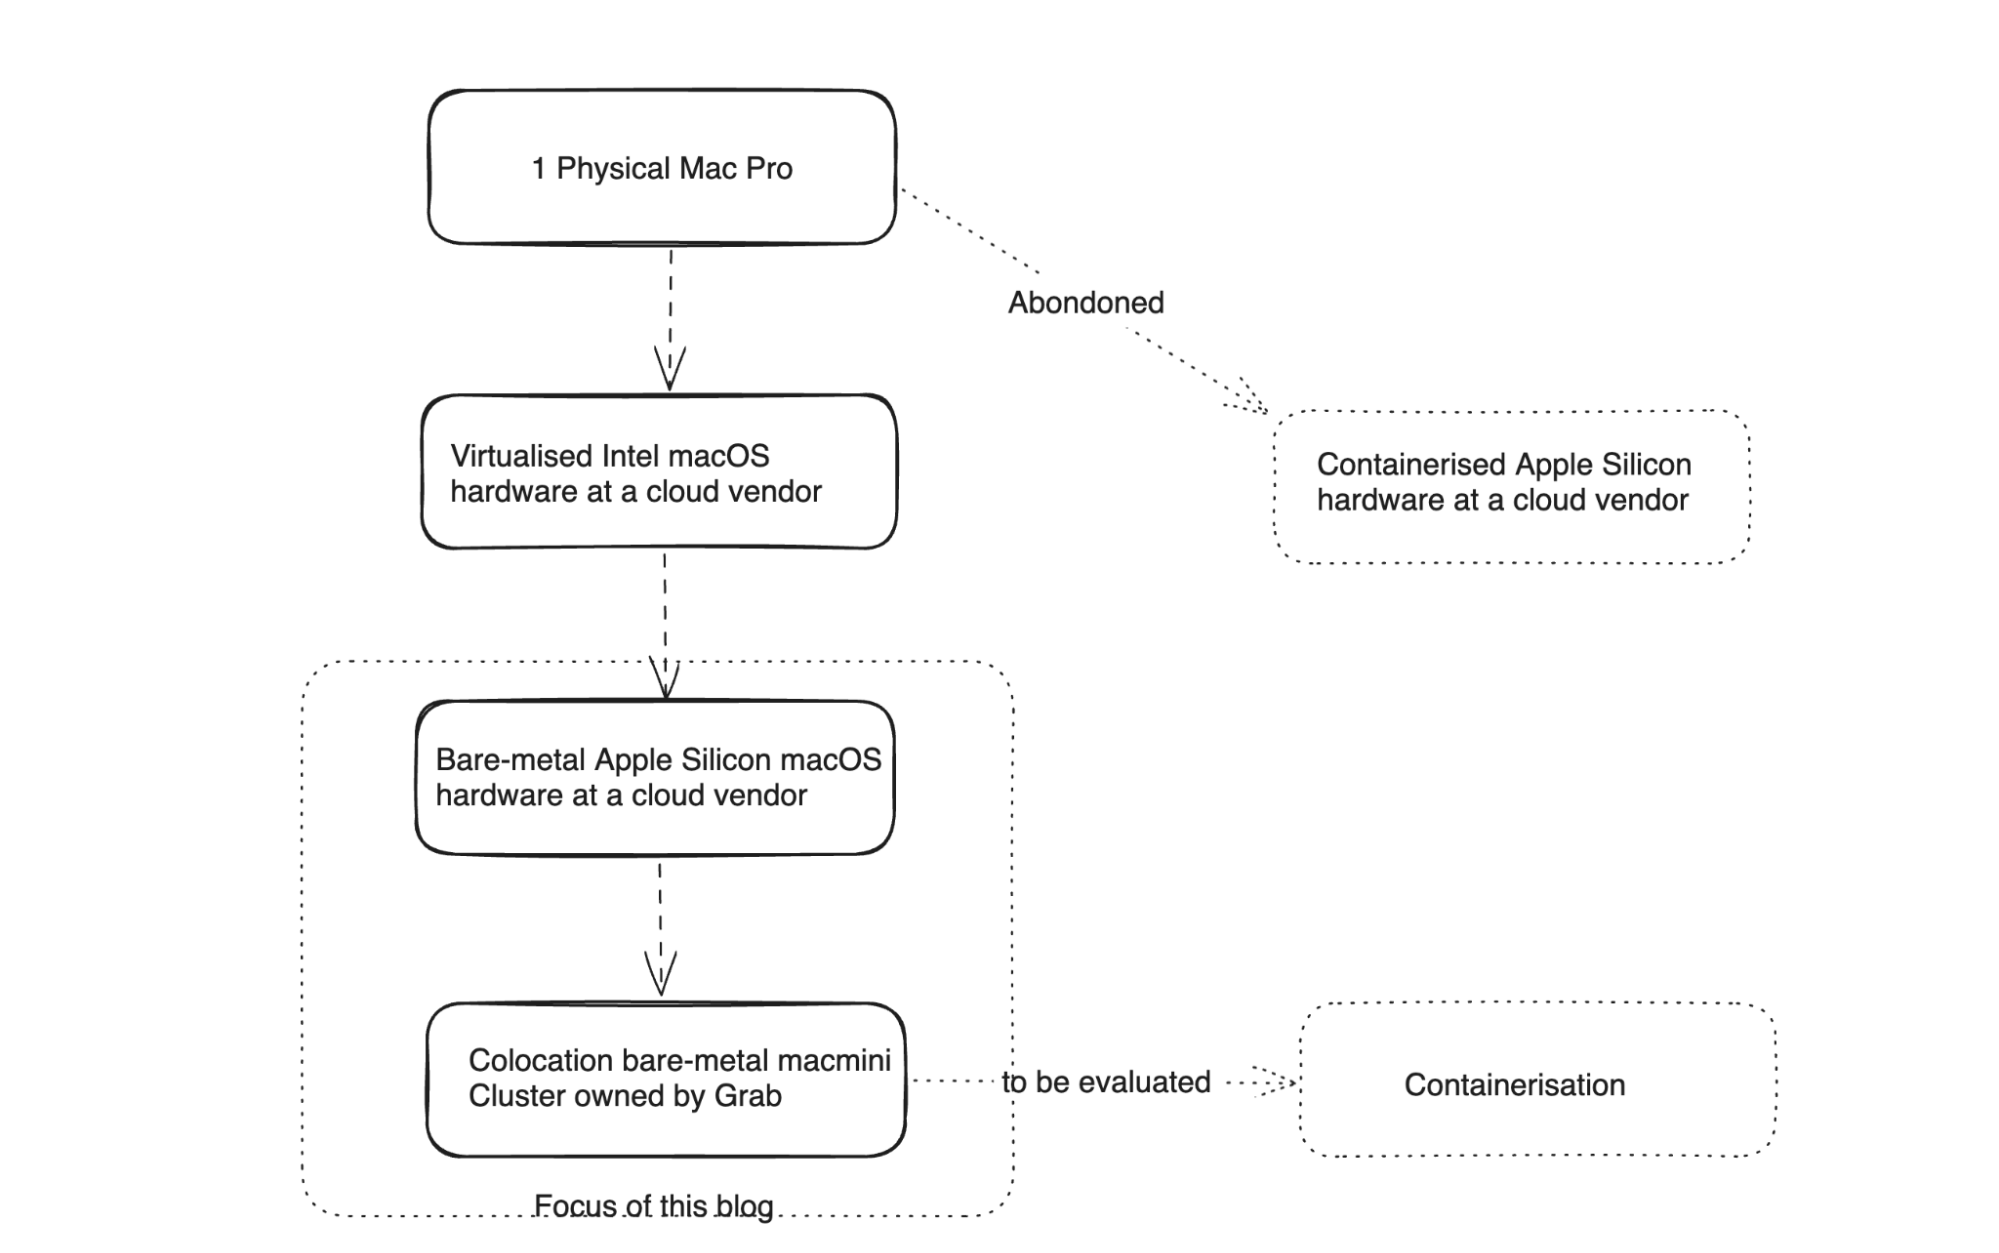
Figure 1. Infrastructure transition path
Before and After: Visualizing the Evolution
Our journey commenced with a much simpler infrastructure setup.
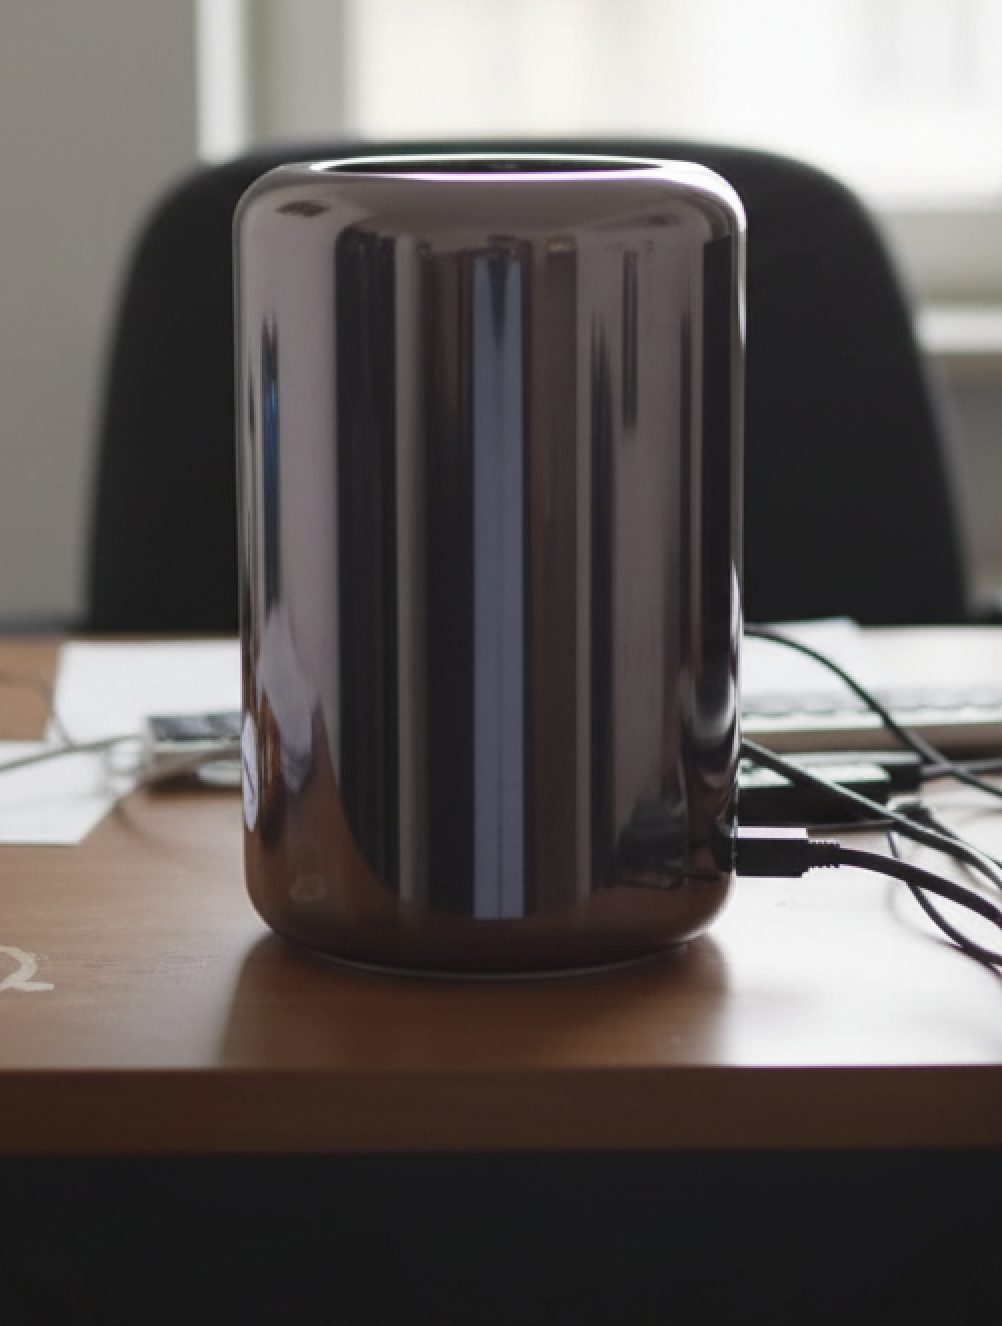
Figure 2. Initial setup
Today, that infrastructure has scaled extensively to meet Grab's ever-growing demands.
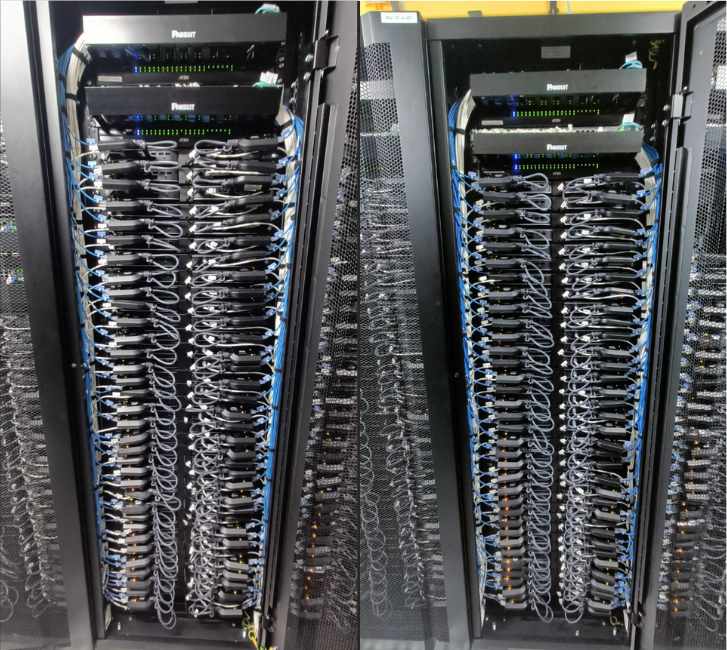
Figure 3. The Mac mini cluster today
Economy at Scale: The Rent vs. Own Equation
Initially, renting macOS hardware was an obvious choice when our demand surged from 1 Mac Pro to 20 times that capacity. However, as this grew to over 200 machines, the cumulative cost became substantial, prompting us to re-evaluate and consider critical questions:
- What level of reliability do we require for this cluster?
- What would be the total cost of ownership (TCO) if we built this cluster ourselves, compared to cloud-based alternatives?
- What operational advantages would we gain by controlling the entire end-to-end stack?
Grab's Scale
At Grab, our iOS build requirements have scaled significantly, transitioning from running builds on a single Mac Pro to utilizing a fleet of over 250 Mac minis. This growth, naturally, was accompanied by a proportionate increase in costs.
Active Jobs Trend
The trend of active jobs serves as a key data point to understand our demand situation. The chart below provides a snapshot of our demand curve in 2022. Peak demand frequently began to exceed available supply, leading to job queues. We estimated a need for over 200 machines to comfortably meet peak demand and projected a requirement for more than 400 machines by 2025.
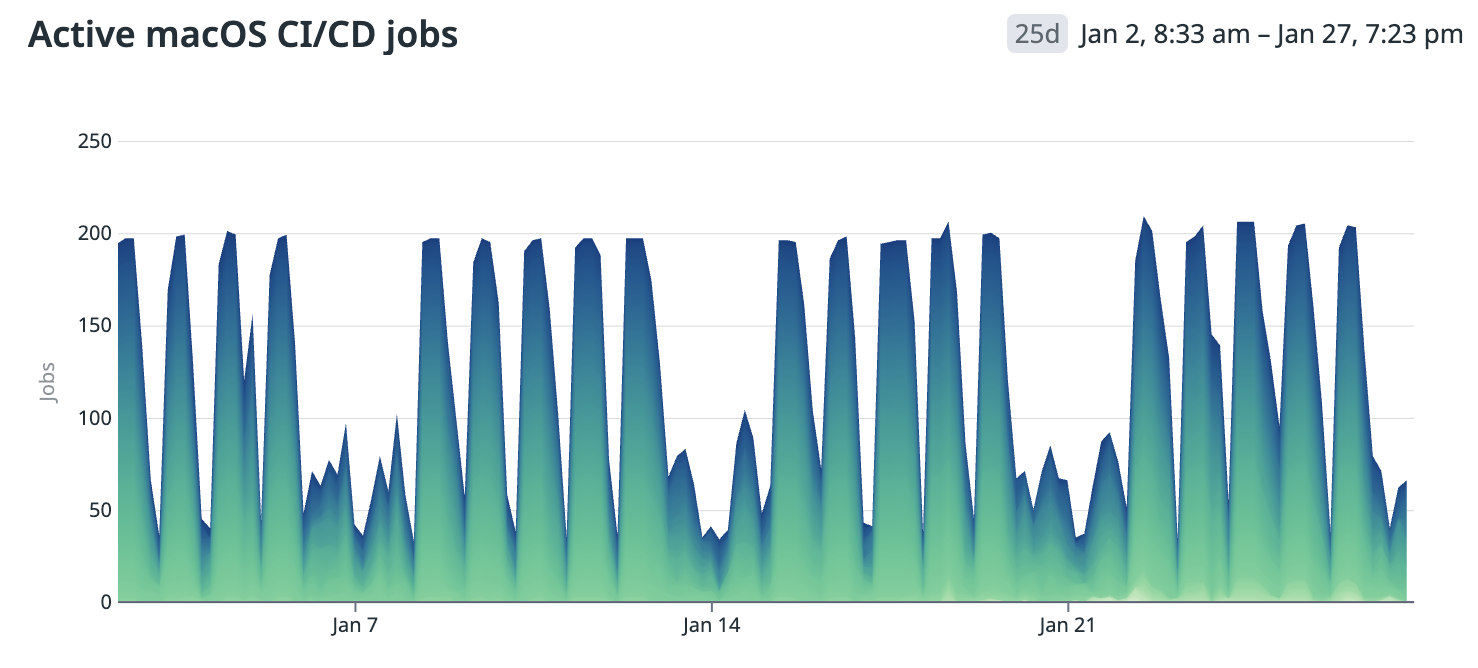
Figure 4. Active macOS CI/CD jobs
Our Workload
We manage several iOS applications that share a common macOS compute cluster for their CI/CD workloads. These include, but are not limited to:
- Grab app (Our largest iOS codebase, with approximately 2.5 million+ total lines of code)
- Grab Driver app (Our second largest iOS codebase, with approximately 0.7 million+ total lines of code)
- KartaLink
- GrabMerchant
- KartaView
- OVO
- Move It: Fast Moto Taxi Ride
- Move It Driver App
The primary tasks involved are:
- Building applications
- Executing tests
The Evaluation: Cloud vs. Colocation vs. On-premises
We conducted a comprehensive comparison and Total Cost of Ownership (TCO) estimation, evaluating various options including different cloud vendors and colocation facilities in multiple locations.
Cost of macOS Compute
The expense of macOS compute is notably higher, especially in Continuous Integration (CI) setups, which presents challenges for optimal configuration. Several factors contribute to these elevated costs:
- Apple’s restrictive End User License Agreement (EULA) mandates a minimum lease period of 24 hours for macOS instances, fundamentally altering utilization economics.
- Economies of scale are less favorable for available macOS hardware configurations compared to alternatives. Optimized server hardware designed for racking offers diverse configurations that significantly reduce operational costs, unlike macOS options such as the Mac Mini and Mac Pro.
For example, while not a direct comparison, the pricing for GitHub Actions build minutes shows macOS as ten times more costly than Linux. This disparity reflects the pricing GitHub can offer after implementing racking optimizations.
Initially, we performed rough estimations to assess the TCO differences between cloud, colocation, and on-premises setups. Even with conservative estimates for manpower and engineering costs, colocation or on-premises solutions proved more cost-effective at our scale. This cost disparity became even more pronounced when considering cloud vendors offering macOS compute physically located in Southeast Asia.
We opted to conduct an in-depth evaluation of the following options:
- Establishing a macOS cluster at our headquarters in Singapore, which was quickly dismissed due to scalability and cost concerns, making it an unsuitable long-term solution.
- Colocating in a Southeast Asian country where we already have an operational presence.
Choice of Location
As a Southeast Asian company, Grab maintains offices in every country where we operate, with some regions boasting advanced data center infrastructures. We narrowed our location choices to Singapore and Malaysia, assessing them based on several key criteria:
- The maturity of existing data center infrastructure.
- Proximity of data centers to our offices, ensuring staff availability for infrastructure setup and maintenance.
- The cost and reliability of power.
- Proximity to our Git servers and the expense of establishing direct network connections.
Ultimately, we decided to proceed with colocation in a data center in Malaysia, which is emerging as one of the region's data center powerhouses, offering relatively lower energy costs compared to Singapore.
Choice of Mac Hardware
Our hardware selection for our build and test workloads was guided by a thorough cost-benefit analysis. We chose bare-metal setups without virtualization, simplifying migration processes – a decision we may revisit in the future. We ensured that the bare-metal hardware was neither over-specified nor under-specified. We had a clear understanding of the resource consumption of our most demanding workloads on a few reference models, as illustrated in the following graphs.
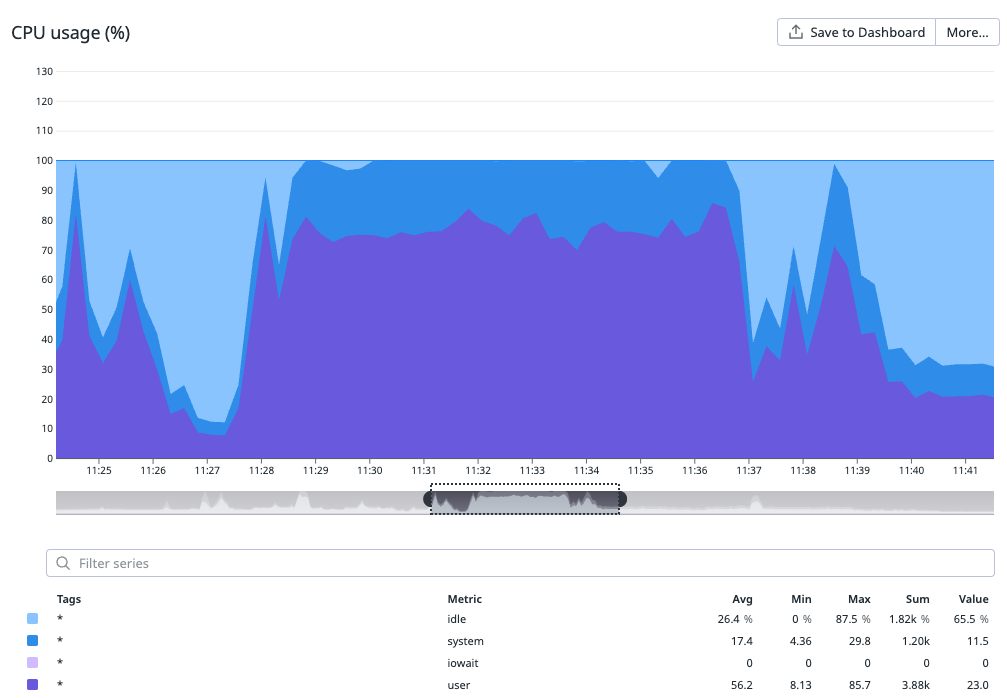
Figure 5. User and system CPU usage during build
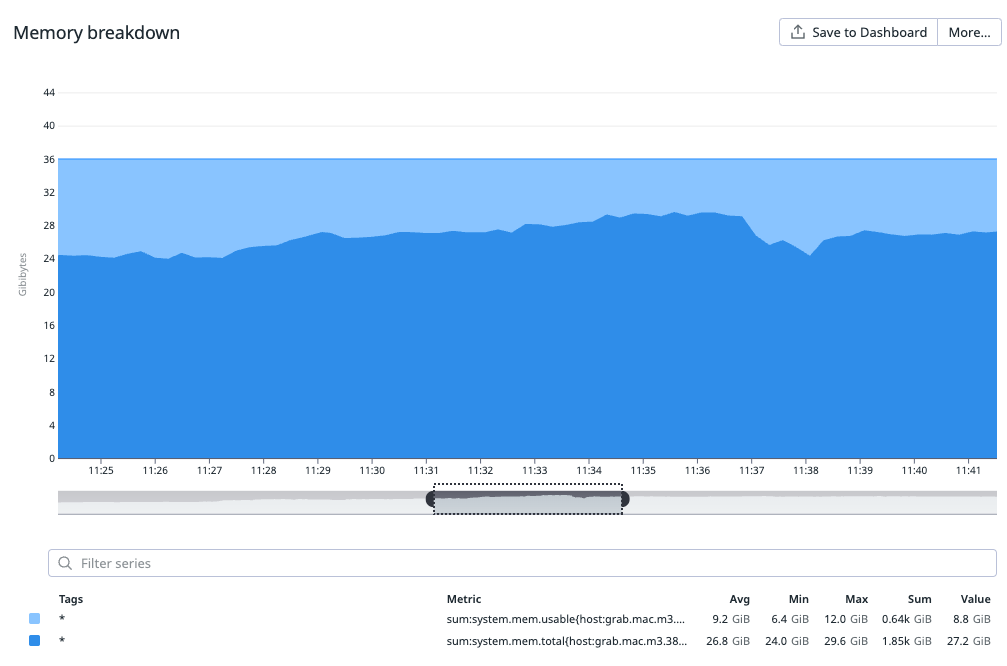
Figure 6. Memory usage
Virtualization vs. Bare-metal
While virtualization offers significant advantages in managing and provisioning clusters, including the flexibility to create ephemeral builds, our experience with macOS virtualization has been mixed. Off-the-shelf virtualization solutions often provide maintenance benefits but can come at the cost of performance or stability.
Key considerations:
- Improved Utilization: Virtualization can enhance resource utilization by consolidating multiple workloads on fewer physical servers, thereby potentially reducing overall cost.
- Performance Penalty: However, the performance penalty associated with virtualization can sometimes negate these cost benefits. This has been particularly true for macOS virtualization, where we've observed trade-offs in performance or stability.
- Evolution of Virtualization: The virtualization landscape is continuously evolving and making significant progress. We may re-evaluate these solutions in the future as they continue to mature and potentially address current performance and stability issues.
Our conclusion was to stick with bare-metal for the time being, as the observed benefits did not sufficiently justify the downsides and additional costs.
Execution: Progressive Migration
Given the scale of our operations, any disruption to the macOS CI/CD cluster would have been enormously disruptive to the company. Therefore, we progressively enabled the new cluster for a portion of our workload over a reasonably long period, meticulously monitoring and comparing:
- Job failure rate
- Job performance
- Reliability
Once we were fully confident in the new setup, we completed the full switch and terminated vendor contracts as they came due.
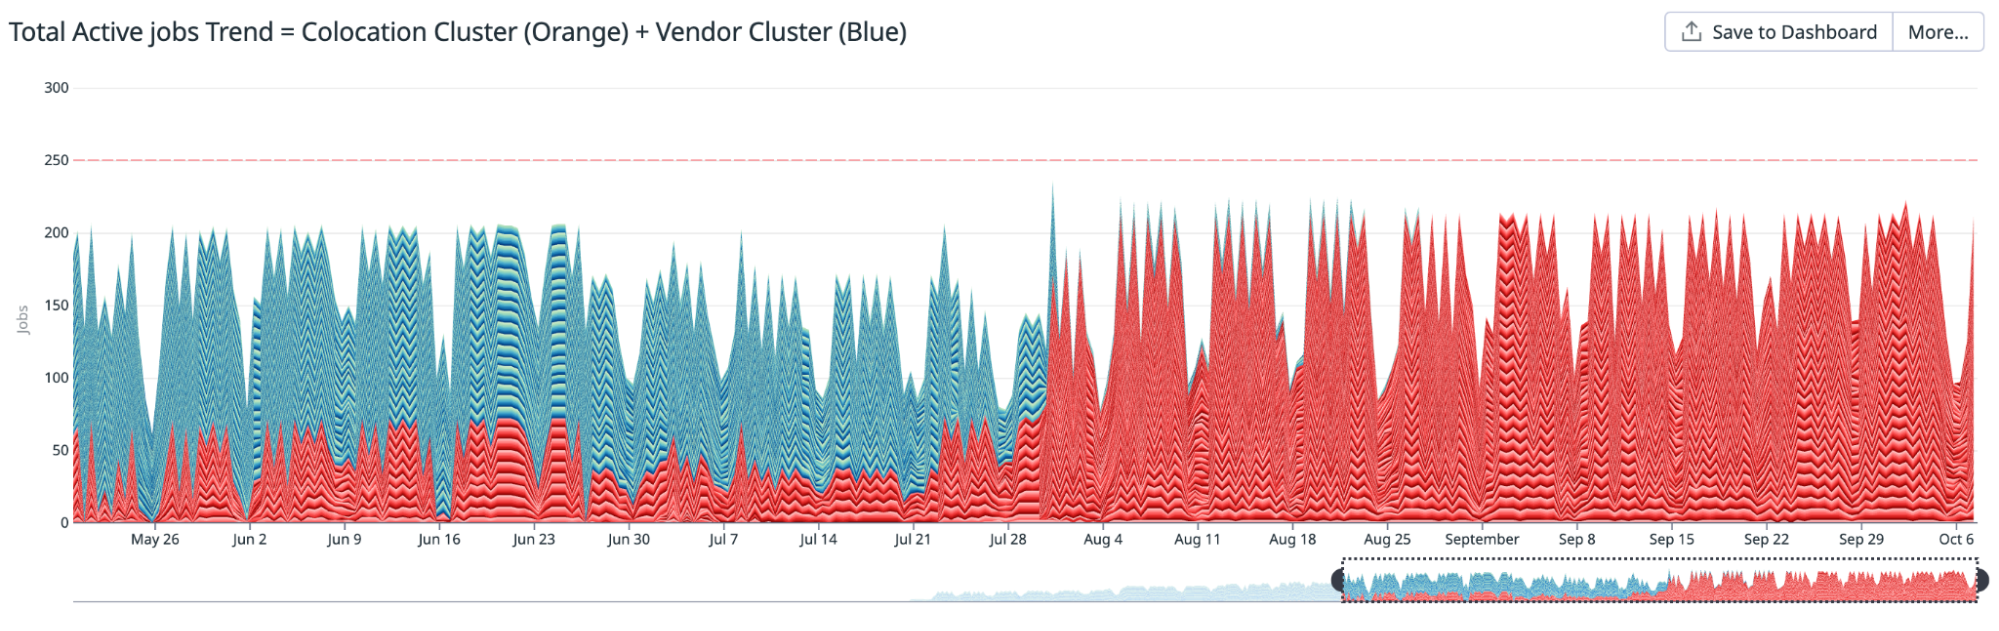
Figure 7. Total active jobs trend
Results
The migration yielded results that surpassed our initial conservative estimates.
- Cost Savings: An estimated over $2.4 million USD saved over three years.
- Performance Improvement: Gains of 20-40% depending on the specific use case.
- Stability: No compromise in stability.
This project represents a strategic investment in our mission to drive Southeast Asia forward by onshoring critical Mac infrastructure into the region.
Cost Analysis
We anticipate a three-year replacement cycle for our hardware. While some equipment might be utilized beyond this period, it serves as a reasonable lifespan for cost estimation. The lifecycle of networking equipment involves both physical reliability (following the bathtub curve) and technological obsolescence, often requiring replacement every 3 to 5 years. Mac minis, too, could become outdated after approximately three years, making the opportunity cost of extended use potentially higher than the net replacement cost after accounting for benefits.
Crucially, the experience gained during this cycle is expected to significantly reduce the engineering costs associated with future replacements.
Overall, we project total cost of ownership savings of approximately $2.4 million USD over a three-year period compared to our previous cloud-based setup rented from a vendor.
Performance Improvements
We measured performance gains in two of our largest iOS applications:
- Grab app
- Grab Driver app
Overall Gains
The following table summarizes the total time measured before and after the migration for the overall CI pipeline time and the application codebase build time. Measurements are presented at three percentiles (p50, p75, p95).
| App / Metric | Time (Minutes) | p50 | p75 | p95 |
|---|---|---|---|---|
| CI pipeline time trend for the Grab app | ||||
| Before | 43 | 54 | 67 | |
| After | 33 | 42 | 49 | |
| Gain | 23.26% | 22.22% | 26.87% | |
| App build time trend for the Grab app | ||||
| Before | 10.7 | 13.2 | 17.6 | |
| After | 6.45 | 9 | 10.8 | |
| Gain | 39.72% | 31.82% | 38.64% | |
| Pipeline time trend for the Grab Driver app | ||||
| Before | 47 | 50 | 52 | |
| After | 26 | 31 | 32 | |
| Gain | 44.68% | 38.00% | 38.46% | |
| App build time trend for the Grab Driver app | ||||
| Before | 10 | 13 | 14 | |
| After | 6 | 8 | 8.5 | |
| Gain | 40.00% | 38.46% | 39.29% |
A Different Perspective: Trends
The following trend illustrations demonstrate how the performance of various tasks improved as we progressively migrated to the new colocation setup.
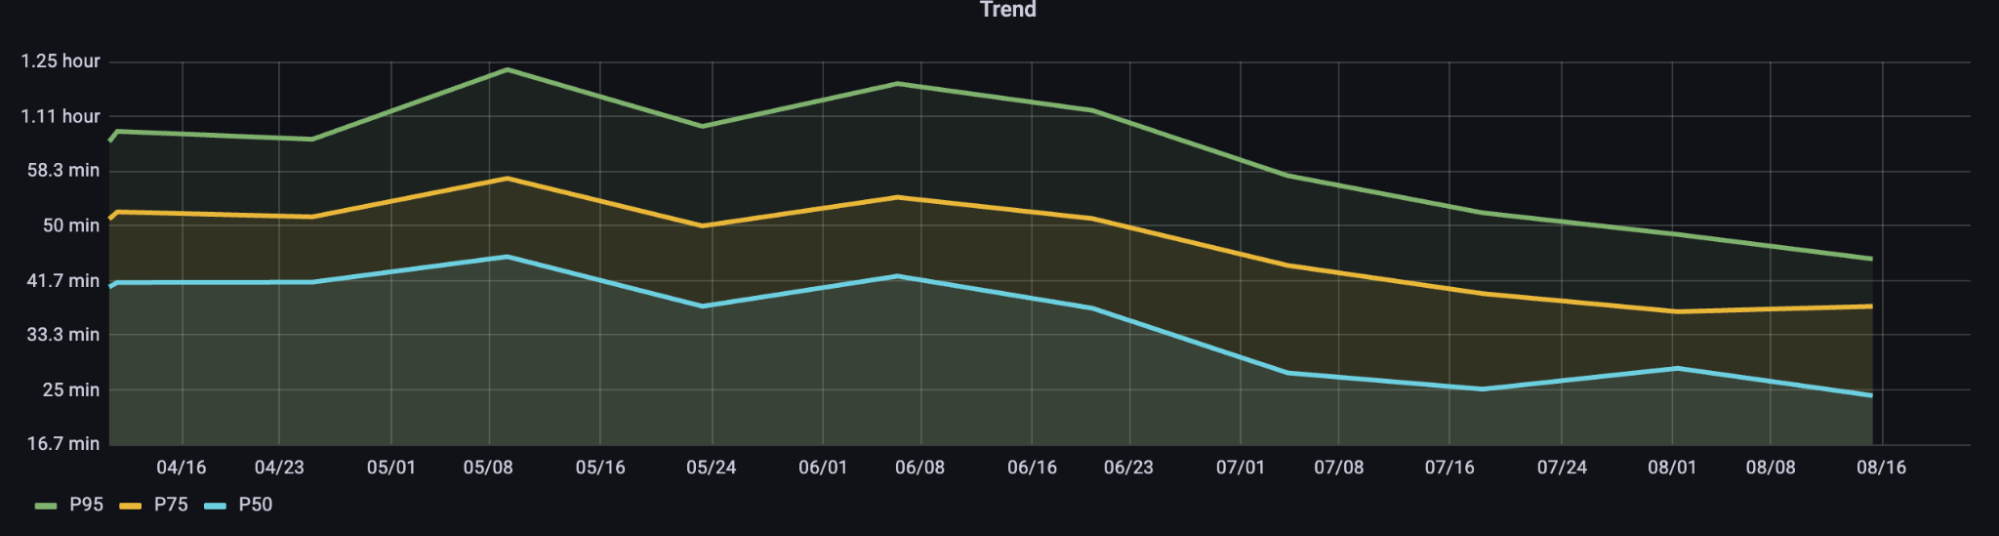
Figure 8. 14-day aggregate percentiles (p50, p75, p95) for total CI pipeline times for the Grab app codebase
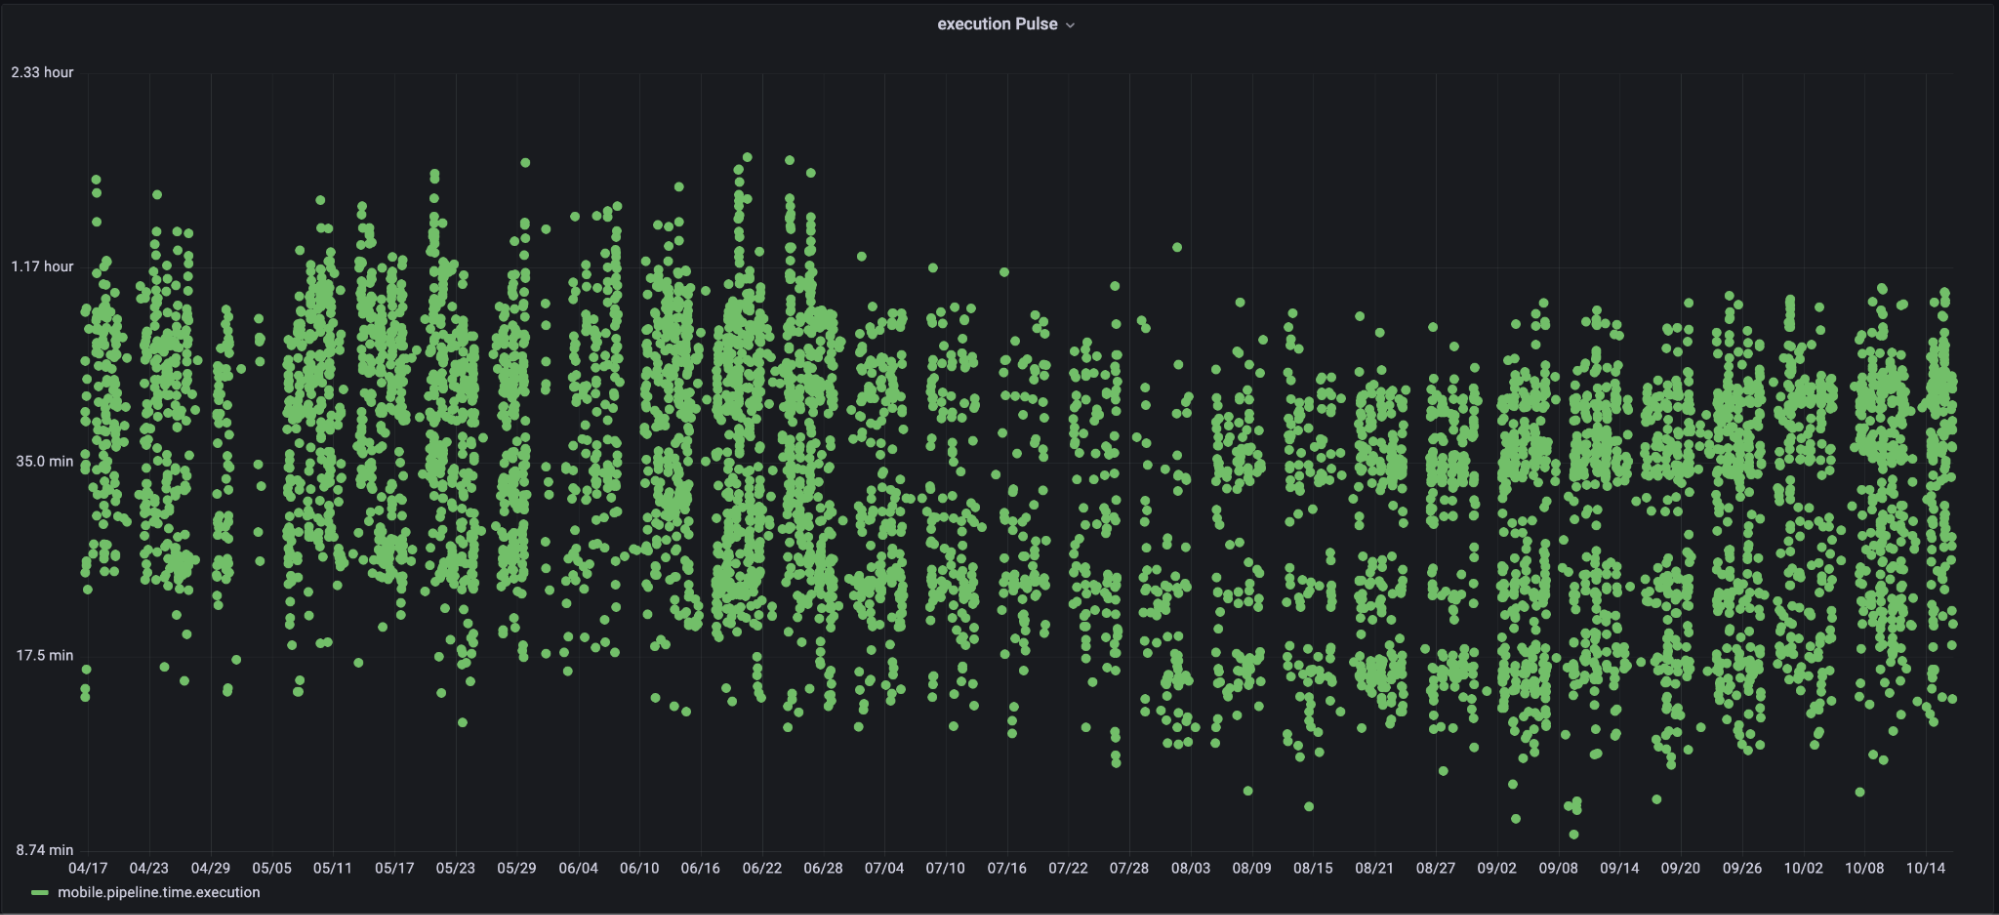
Figure 9. Pipeline time pulse for the Grab app codebase
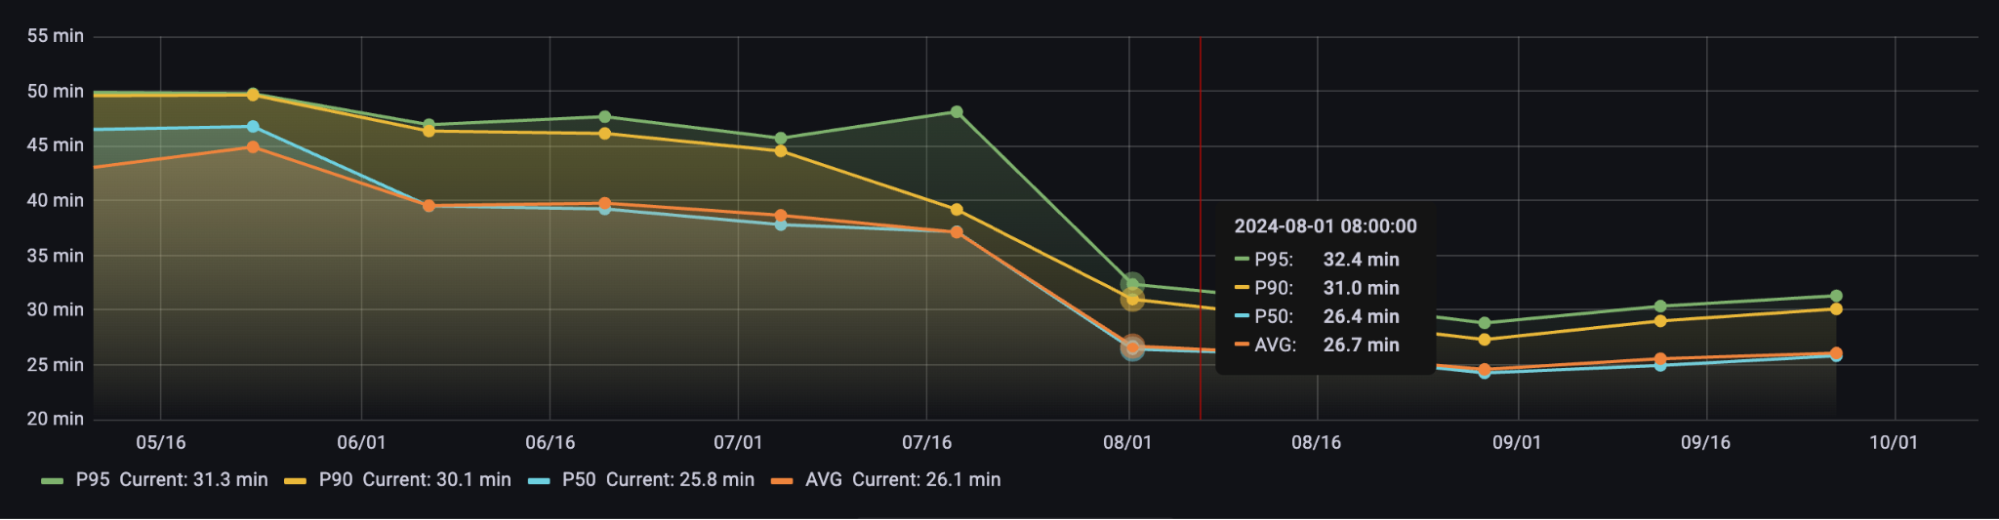
Figure 10. 14-day aggregate percentiles (p50, p75, p95) for total CI pipeline times for the Grab Driver app codebase
Stability
We meticulously measured overall job failure rates between both clusters over extended periods as a critical guardrail metric. This allowed us to ensure the robust stability of the new cluster before decommissioning the old one.
Colocation Setup and Rack Configuration
The table below provides an overview of the layout for our new Mac mini cluster.
| Component | Description | Redundancy |
|---|---|---|
| Rack | Four 42RU (600x1200x42RU) racks housing 200+ Mac minis, plus spare racks for scheduled capacity upgrades. | Racks share resources with their own redundancy. Rack separation generally provides some level of redundancy for total compute. |
| Power | Two independent power sources power the cluster. Each rack is powered by these two sources, with a 1U, 2-post rack mount setup. | Losing one power source will reduce capacity by 50%. |
| Mac Mini | We rack two Mac minis per mounting tray, typically housing 70 minis in one rack. The first rack requires extra rack units (RUs) for core switches and firewalls. | N/A |
| KVM | KVM switches with adapters for keyboard and mouse emulation when needed. | N/A |
| Networking Setup | Networking comprises Core Switches, Access Switches, Firewalls, Internet, and Direct Connect Links. | Mostly active/active redundancy. |
Provisioning and Configuration: Zero-Touch Provisioning
Zero-touch provisioning is a streamlined method for setting up and configuring devices with minimal manual intervention. This section outlines the process and key benefits of zero-touch provisioning using Jamf for Mac minis.
Our setup enables these machines to start accepting jobs as soon as they are racked and connected (power and network cables). Here’s how it works:
1. Mobile Device Management (MDM) Configuration and Automated Device Enrollment (ADE)
ADE, formerly known as Device Enrollment Program (DEP), is an Apple service that facilitates automatic enrollment. When a new Mac Mini is acquired and registered in an organization’s ADE account, it is prepped for automatic enrollment. Administrators create a PreStage enrollment configuration within Jamf Pro, which includes account settings (e.g., creating and hiding a local admin account, skipping user account creation), configuration profiles (defining device settings, security policies, and restrictions), and enrollment packages (containing necessary software and scripts).
2. Device Setup: Activation and Redirection
Upon powering on and connecting to the internet, the Mac Mini communicates with Apple’s activation servers. These servers identify the device as part of the organization’s ADE and redirect it to the Jamf MDM server, ensuring automatic enrollment without user input.
3. Enrollment and Configuration
The Mac Mini automatically enrolls into the Jamf MDM system. Jamf then applies predefined configuration profiles to set up the device’s settings, installs required applications based on configured policies, and enforces security policies such as encryption and authentication settings to ensure compliance.
Key Benefits of Zero-Touch Provisioning
- Efficiency: Devices are ready to use right out of the box, significantly reducing the time and effort required by IT staff.
- Consistency: Ensures that all devices are configured uniformly according to organizational policies.
- Security: Enforces security policies from the moment the device is first powered on, minimizing vulnerabilities.
- Scalability: Allows for easy management and configuration of a large number of devices without manual intervention.
Learnings and Insights
The supply chain is only as fast as its last essential component.
This fundamental principle is worth reiterating: the efficiency of any supply chain is ultimately determined by the delivery of its final essential component. Our timely launch was facilitated by incorporating a buffer period for unexpected delays. Interestingly, one of the last critical items to arrive was the rack mounting trays. This brief delay underscored the importance of meticulous planning and prioritizing the on-time delivery of every essential component, regardless of its apparent simplicity in manufacturing.
Consistently address the question: How will this scale?
From the outset, our objective was to develop a scalable infrastructure. As the cluster expands, tasks such as preparing Mac minis for job acceptance would typically require increasing manual input, which directly impacts costs. Therefore, zero-touch provisioning became not merely a desirable feature but an essential necessity for true scalability.
Plan and opt for a power cost structure that best suits your needs.
Power Cost Structures in Colocation
In a colocation setup, power costs can be billed in several ways, each with its own advantages and disadvantages:
- Flat rate per circuit: A fixed monthly fee, offering predictability but limiting flexibility (e.g., you can't typically exceed 80% utilization without incurring extra circuit costs).
- Allocated kW: Committing to a fixed power amount (e.g., 100 kW), which can be cheaper but often includes penalties for exceeding the allocation.
- Metered usage: Paying for actual consumption (kWh), ideal for variable loads but may still include charges for occupied space.
- All-in space and power: A single rate covering both, easy to compare but offers less flexibility for future upgrades.
We ultimately opted for an allocated kW commitment, implementing a phased approach based on conservative equipment power ratings and historical usage. We structured this into incremental commitment increases to accommodate future capacity growth.
Conclusion
The Mac Cloud Exit was more than just a technical migration; it was a strategic move that fundamentally enhanced our engineering efficiency. By onshoring our infrastructure into Southeast Asia, we have achieved projected savings of $2.4 million USD and supercharged our CI pipeline, delivering performance gains of 20-40%. This project unequivocally demonstrates that taking ownership of our core infrastructure can provide a significant competitive advantage, enabling us to deliver faster and more reliably for our users across the region.
Join Us
Grab is a leading superapp in Southeast Asia, operating across deliveries, mobility, and digital financial services sectors. Serving over 800 cities in eight Southeast Asian countries, Grab empowers millions daily to order food or groceries, send packages, hail a ride or taxi, pay for online purchases, or access services like lending and insurance, all through a single app. Founded in 2012, Grab's mission is to drive Southeast Asia forward by creating economic empowerment for everyone. Grab strives to serve a triple bottom line – simultaneously delivering financial performance for shareholders, fostering positive social impact (including economic empowerment for millions), and mitigating our environmental footprint.
Powered by technology and driven by heart, our mission is to create economic empowerment for everyone in Southeast Asia. If this mission resonates with you, join our team today!