Unmasking a Hidden Singleton: A Race Condition Discovery in monday.com AI Reports
Discover how a load test on monday.com's AI Reports feature uncovered a hidden singleton causing race conditions and 400 errors, offering key lessons in state management and testing.

Occasionally, a load test uncovers something truly remarkable, and last week's run on monday.com proved to be one such instance. Dozens of simultaneous "Generate report" clicks against our AI Reports feature – designed to transform live dashboards into interactive, collaborative reports – triggered a cascade of baffling 400 responses.
Investigating this anomaly led us through multiple microservices, GraphQL mutations, and ultimately, to a stealthy singleton residing deep within our codebase.
Here, we detail how we discovered it, why it remained undetected for so long, and the invaluable lessons learned about testing and state management.
Setting the Stage
For those new to monday.com, let's briefly introduce Dashboards and WorkDocs – two powerful foundational elements of the monday WorkOS.
Dashboards
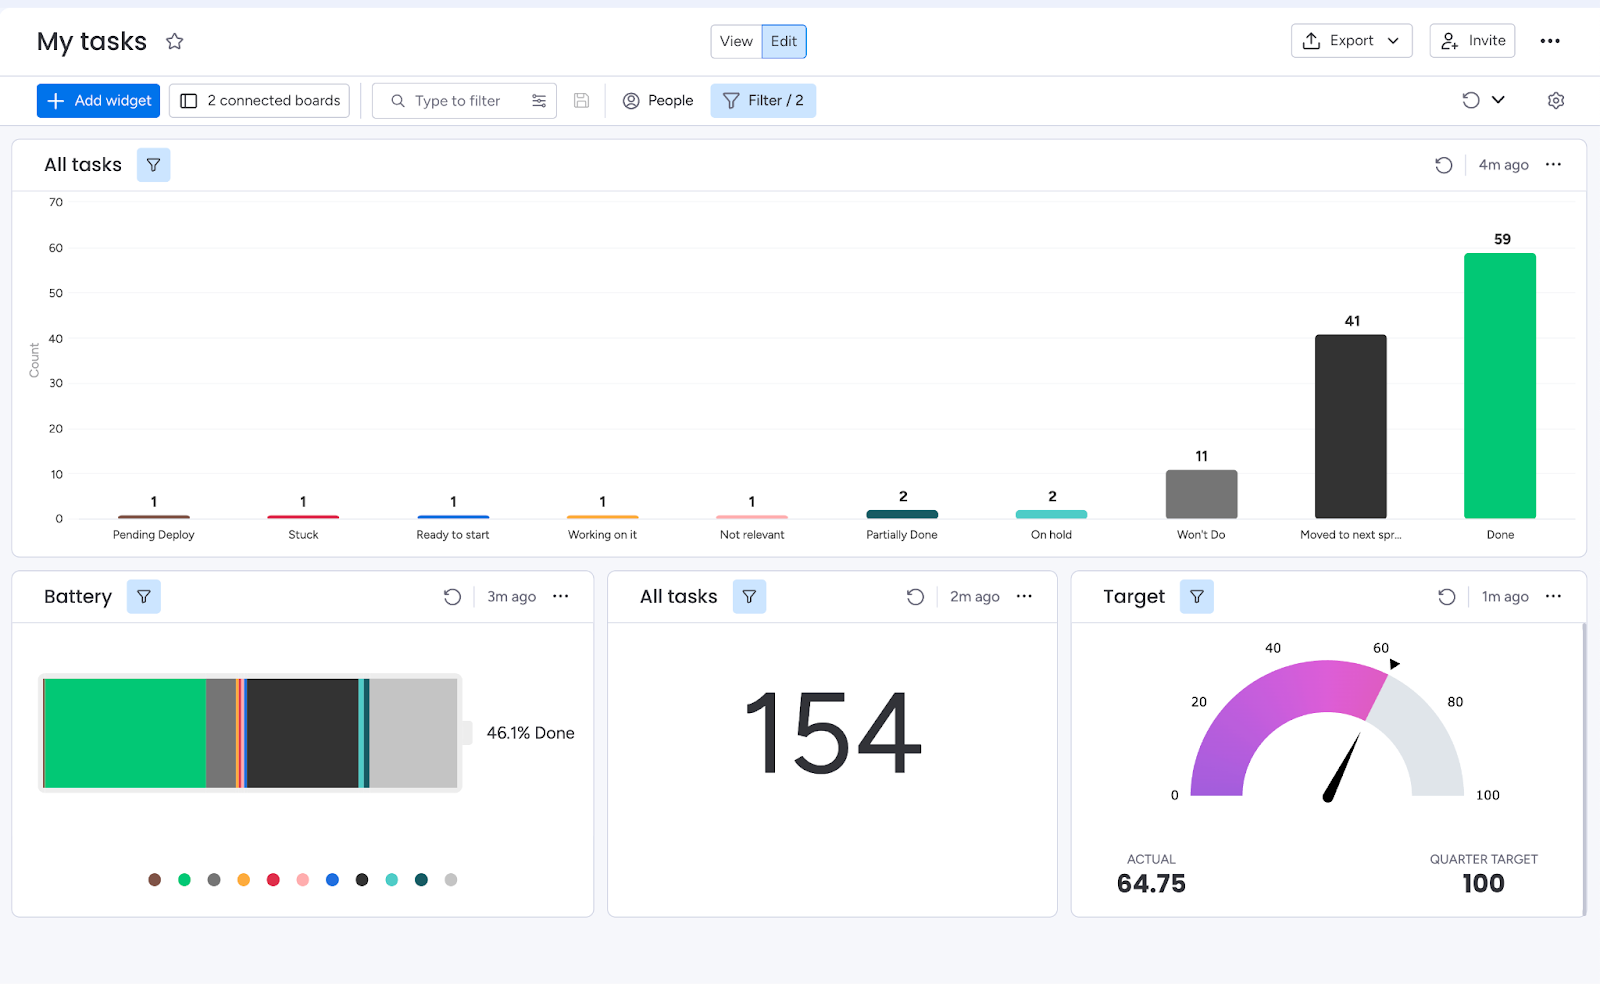
Dashboards enable you to consolidate data from various boards and visualize it in a single location. Each dashboard comprises widgets, with every widget capable of highlighting a distinct segment of information, such as:
- KPI aggregations presented on charts
- Upcoming meetings displayed on a calendar
- Project timelines visualized in a Gantt view
- And much more
Below is an example dashboard:
Monday WorkDocs
WorkDocs are dynamic, real-time documents where teams can collaborate on writing, planning, and discussions. Their integration with your boards and workflows allows for seamless transitions without switching tools.
A WorkDoc is constructed from blocks, which can be almost anything: a widget, an image, a video, a text paragraph, a heading – you name it.
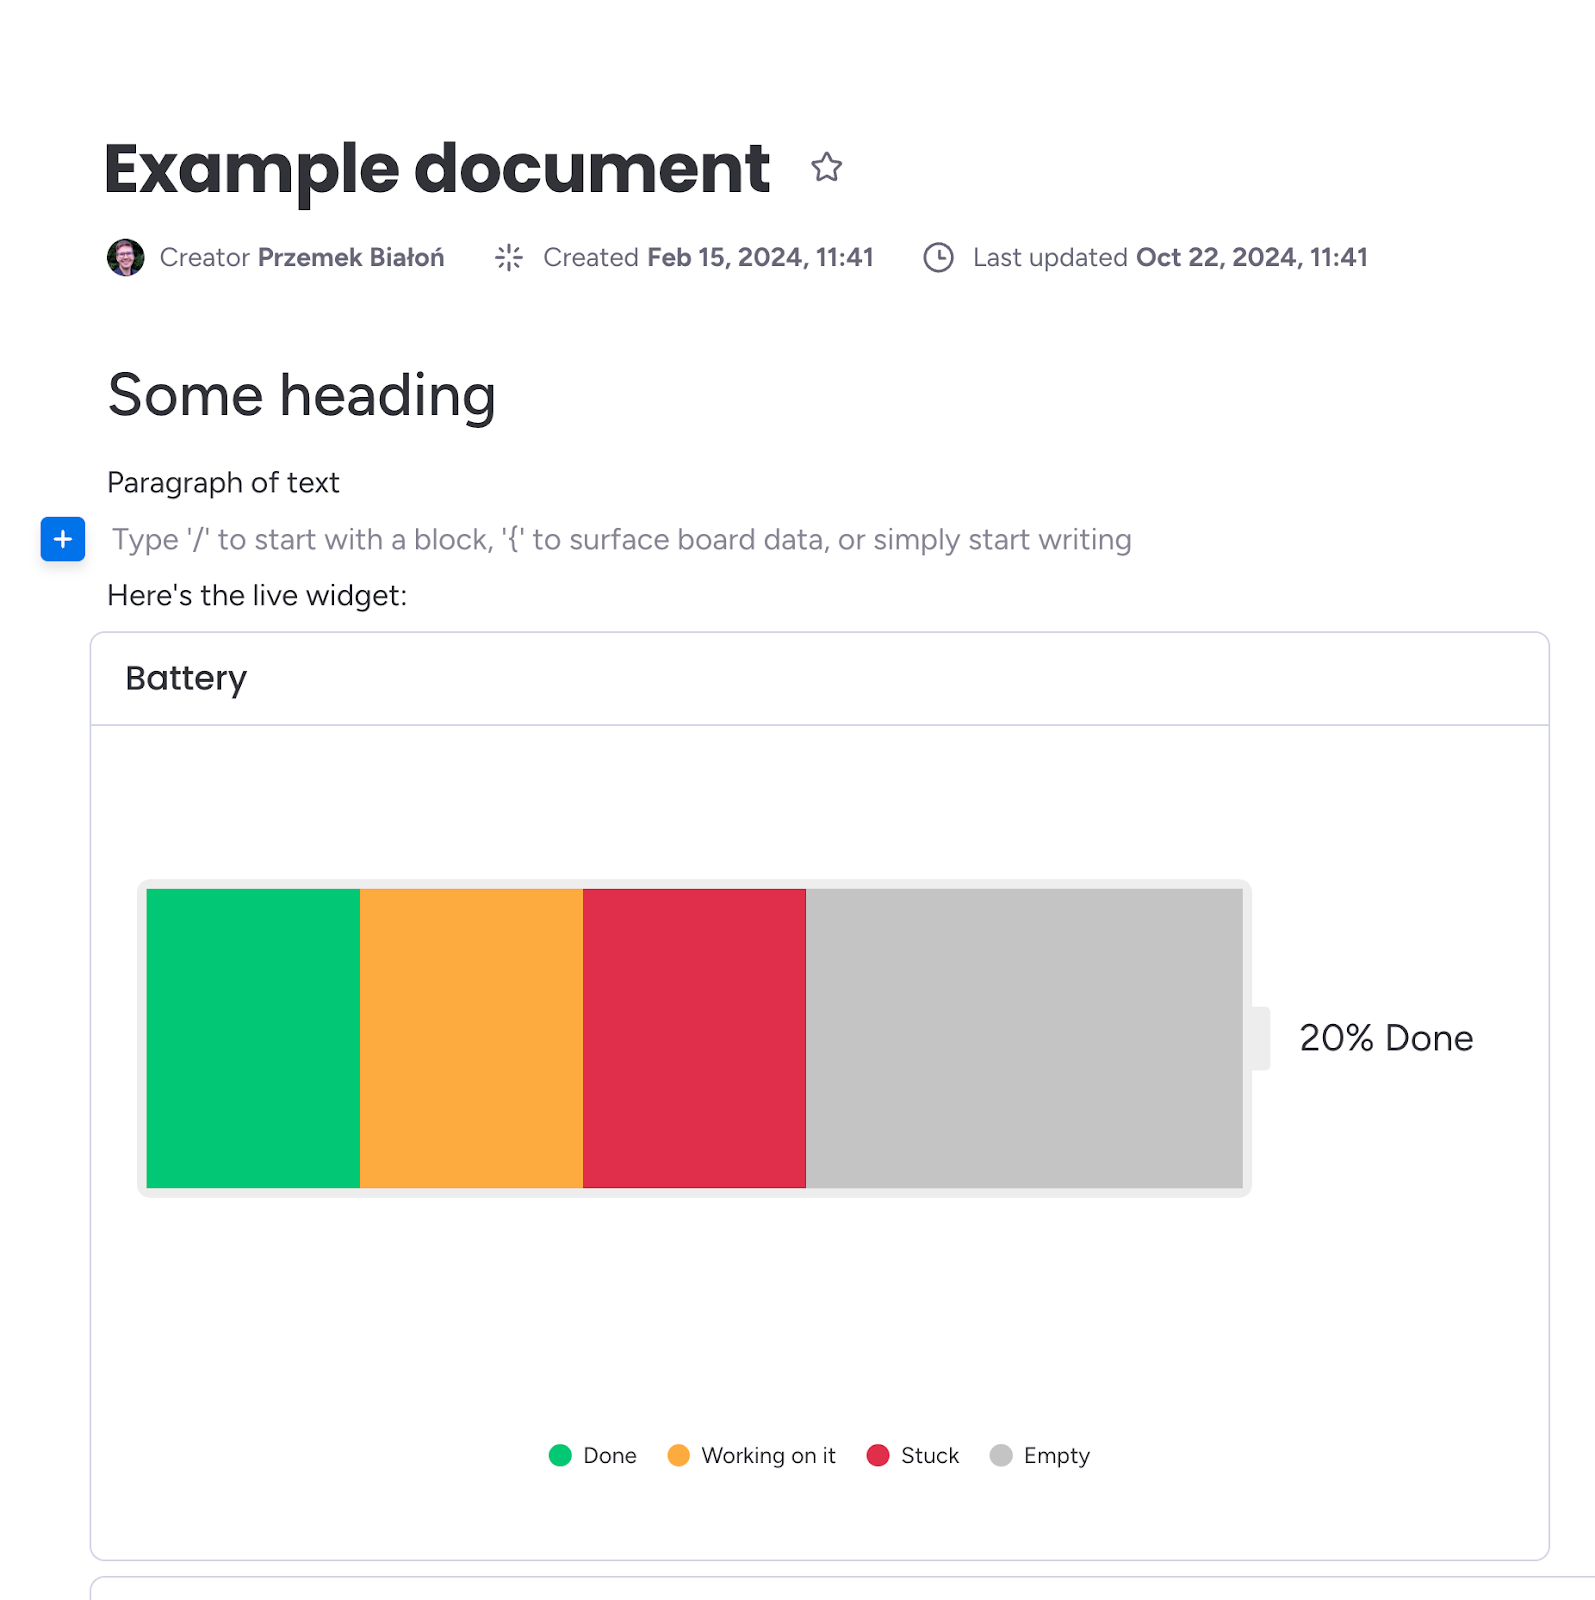
The monday WorkDocs platform also exposes a GraphQL API, allowing programmatic manipulation of documents, including adding blocks, inserting images, and performing nearly any CRUD operation required.
AI Reports
AI Reports is monday.com's innovative capability, offering a one-click solution to convert a live dashboard into a concise, shareable narrative. Instead of manually copying charts, timelines, and metric snapshots into a WorkDoc, users simply press "Generate report," and the platform executes four key actions behind the scenes:
- Snapshot the dashboard: It captures a fresh image of every widget (charts, calendars, tables, etc.), ensuring the report accurately reflects the moment of generation.
- Summarize with AI: Each screenshot, along with pertinent widget metadata, is sent to an internal AI service that generates a summary.
- Compile a WorkDoc: These summaries are returned and meticulously arranged – block by block – into a monday WorkDoc. Screenshots, headings, and AI-generated text are placed side-by-side, maintaining visual and contextual cohesion.
- Deliver in seconds: The completed WorkDoc opens automatically, ready for refinement, sharing, or export.
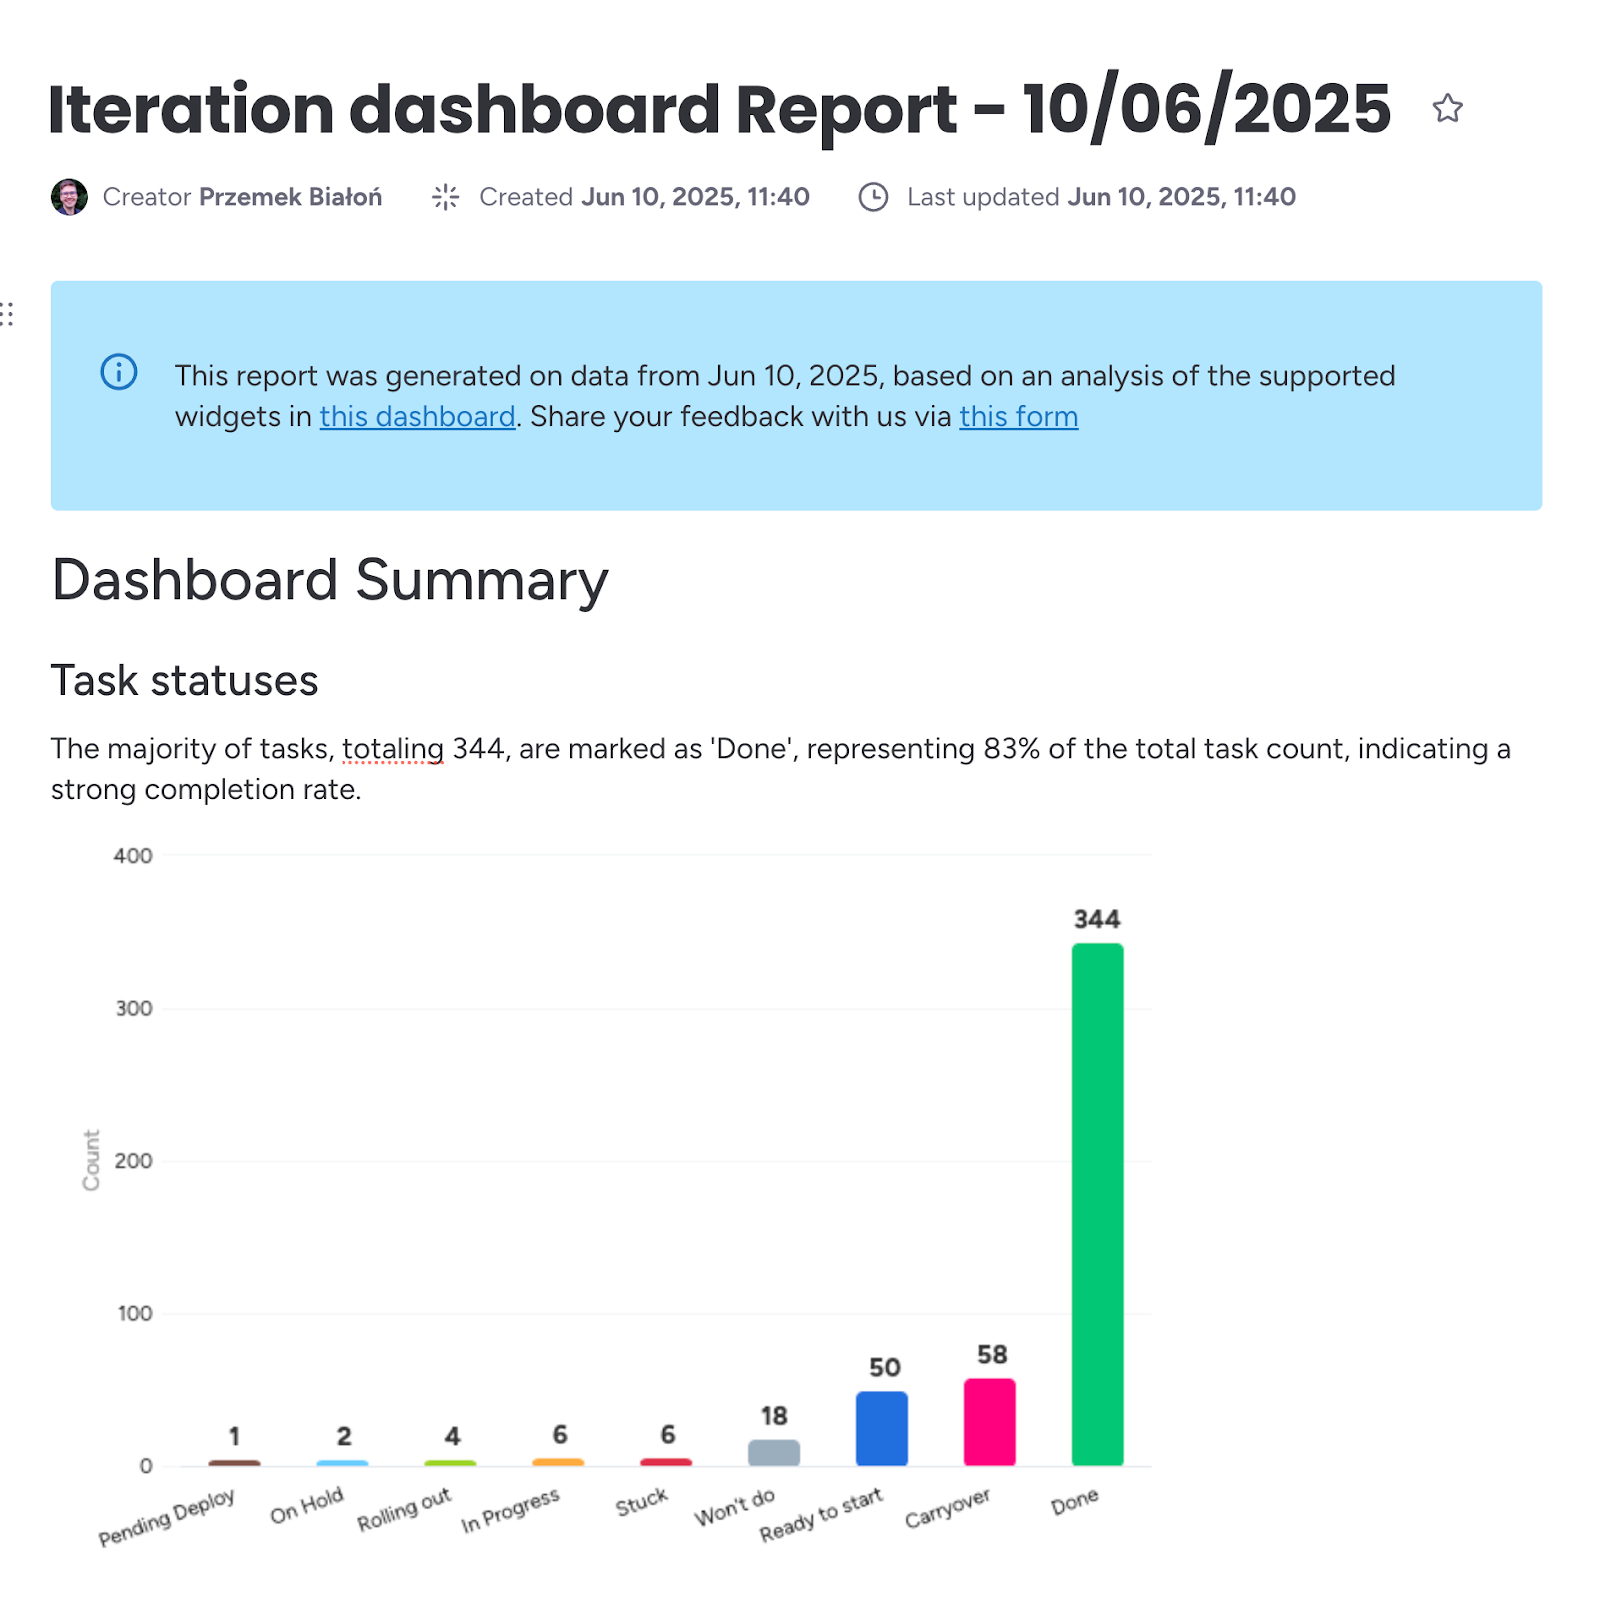
For team leads, this feature transforms a dashboard report that previously took thirty minutes into a single button click. For stakeholders, it adds clear context to raw data without ever leaving monday.com. Here's an example report:
Load Tests
To evaluate the behavior of AI Reports under realistic pressure, I leveraged k6 to script a series of load scenarios. Each scenario spun up to 16 concurrent virtual users, repeatedly clicking "Generate report" across a variety of light, medium, and heavy dashboards – containing anywhere from a few to dozens of widgets. The test ran for several minutes, long enough to cycle through hundreds of reports and allow any hidden contention to surface.
At peak concurrency, things began to unravel. We anticipated downstream services – potentially the WorkDocs API – to start throttling and return 429/500 errors. However, none appeared. Instead, we were inundated with 400 Bad Request responses, indicating that the requests themselves were being rejected well before reaching those limits.
Behind AI Reports: WorkDoc Creation
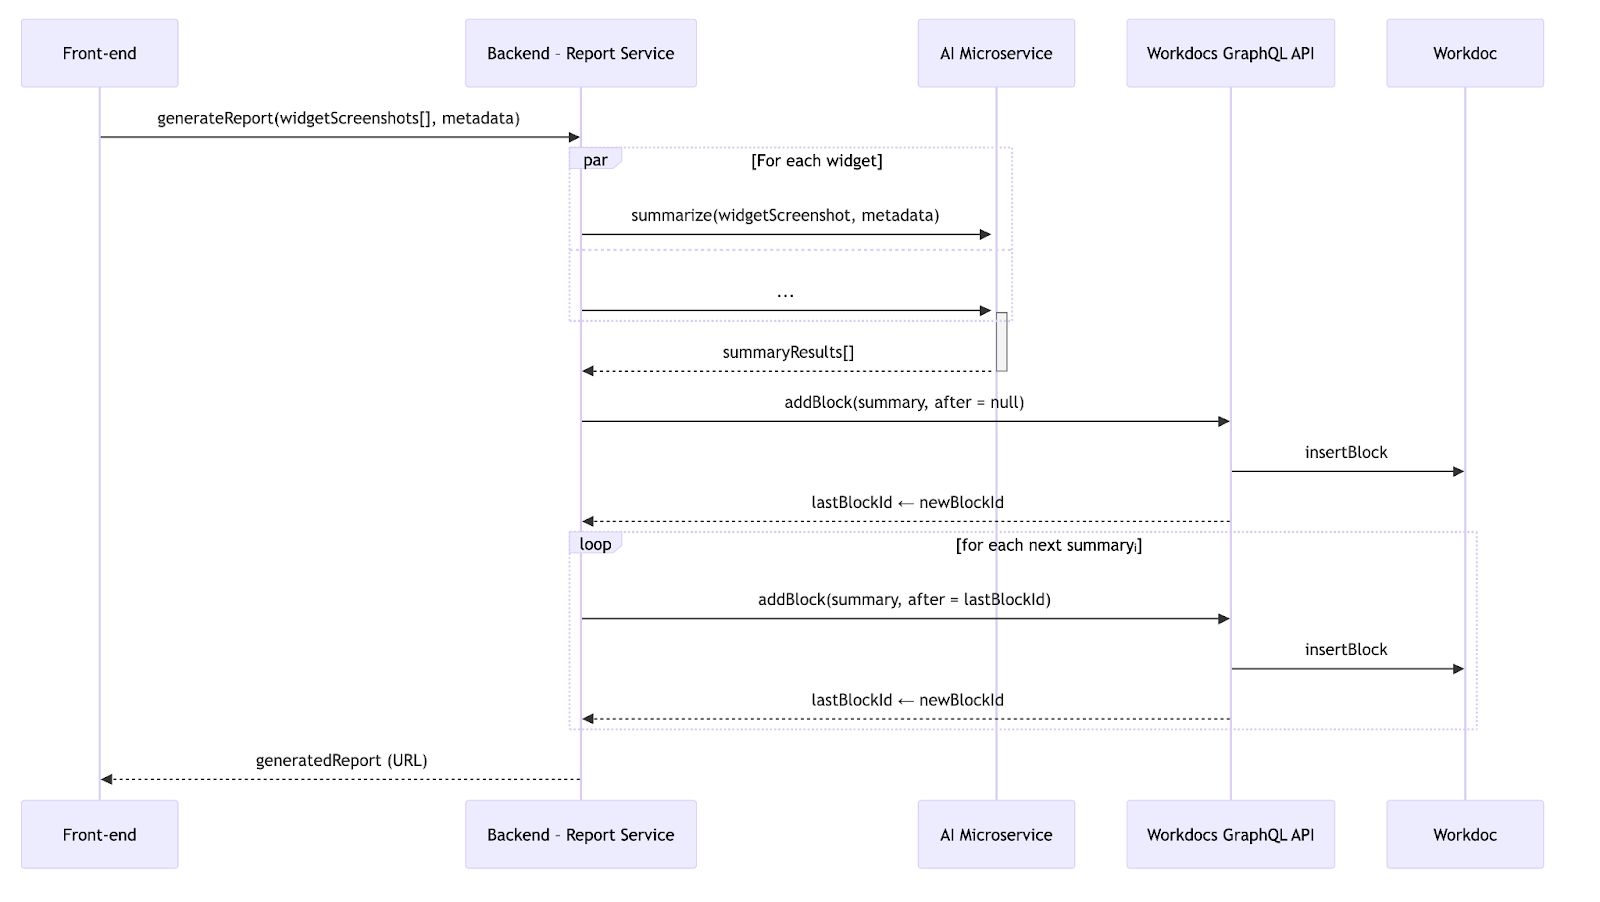
With the broader context established, let's delve into the request flow step by step. When the frontend transmits widget screenshots along with metadata (title, type, etc.), three primary actions occur:
- Fan-out to AI: We initiate parallel requests to an internal AI microservice, which returns a summary block for each widget.
- Fan-in to WorkDocs: Once all summaries are received, we send GraphQL mutations to WorkDocs, adding the blocks sequentially.
- Maintain order: We track the last successfully added block ID and instruct WorkDocs to insert the subsequent block directly after it.
Here's a diagram illustrating the flow:
Armed with this mental model, let's revisit the load test logs.
The Smoking Gun
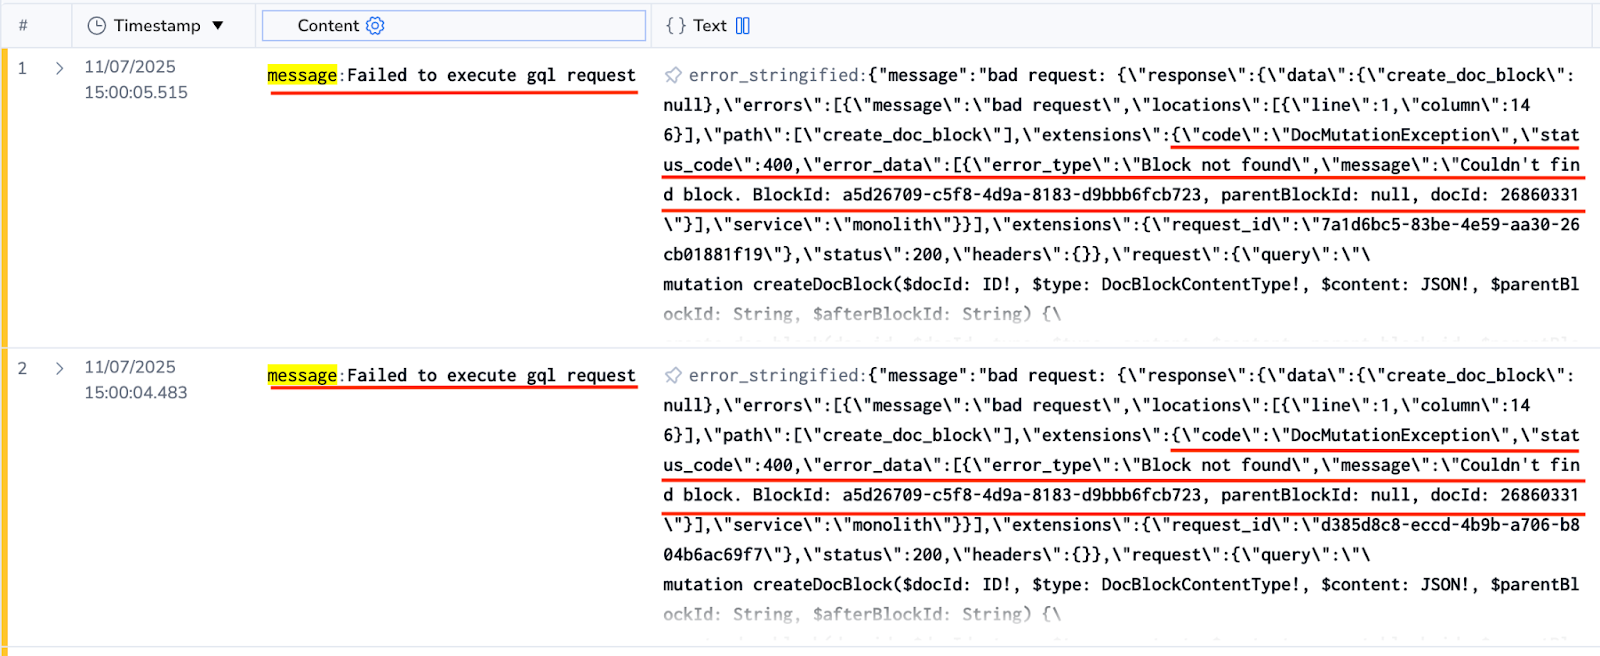
The WorkDocs microservice consistently returned errors:
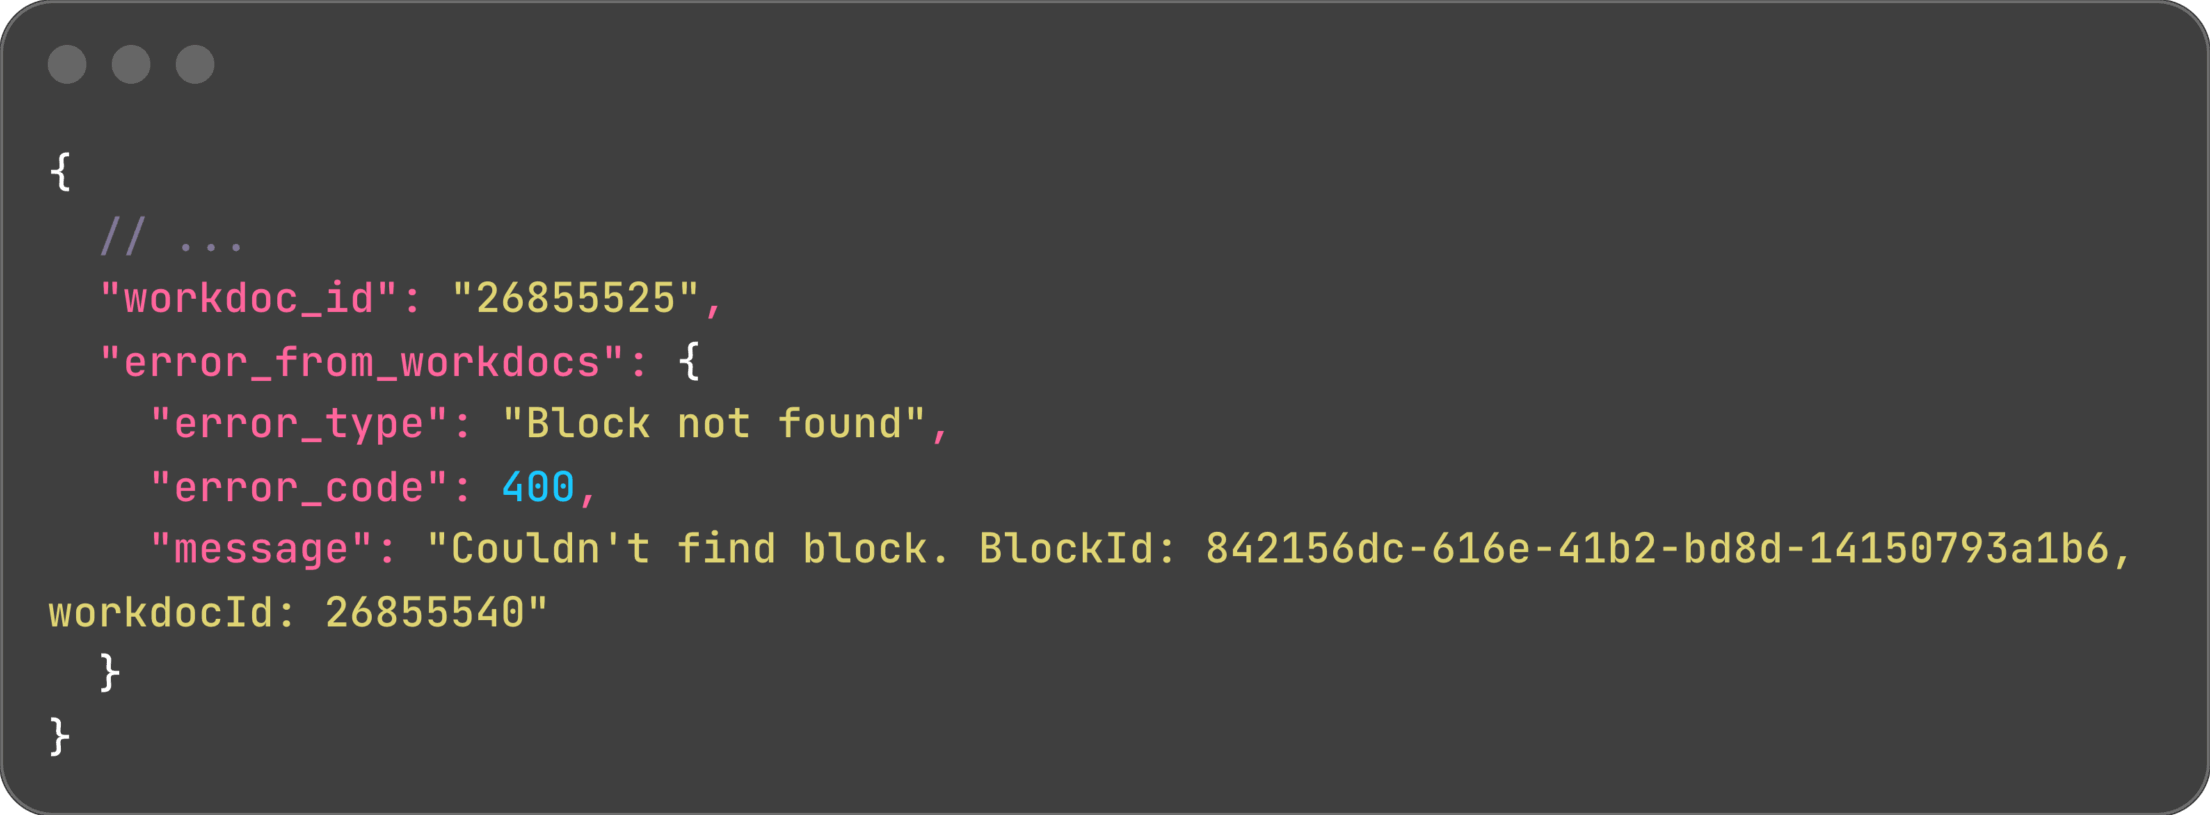
Crucially, the outer log line displayed workdoc_id: 26855525, while the inner error showed workdocId: 26855540. Two distinct WorkDoc IDs within the same request – how could this be?
This was clearly not random data corruption. Every 400 error exhibited the same ID mismatch. It was time to investigate further!
Rabbit Holes, Dead Ends, and the "Aha!"
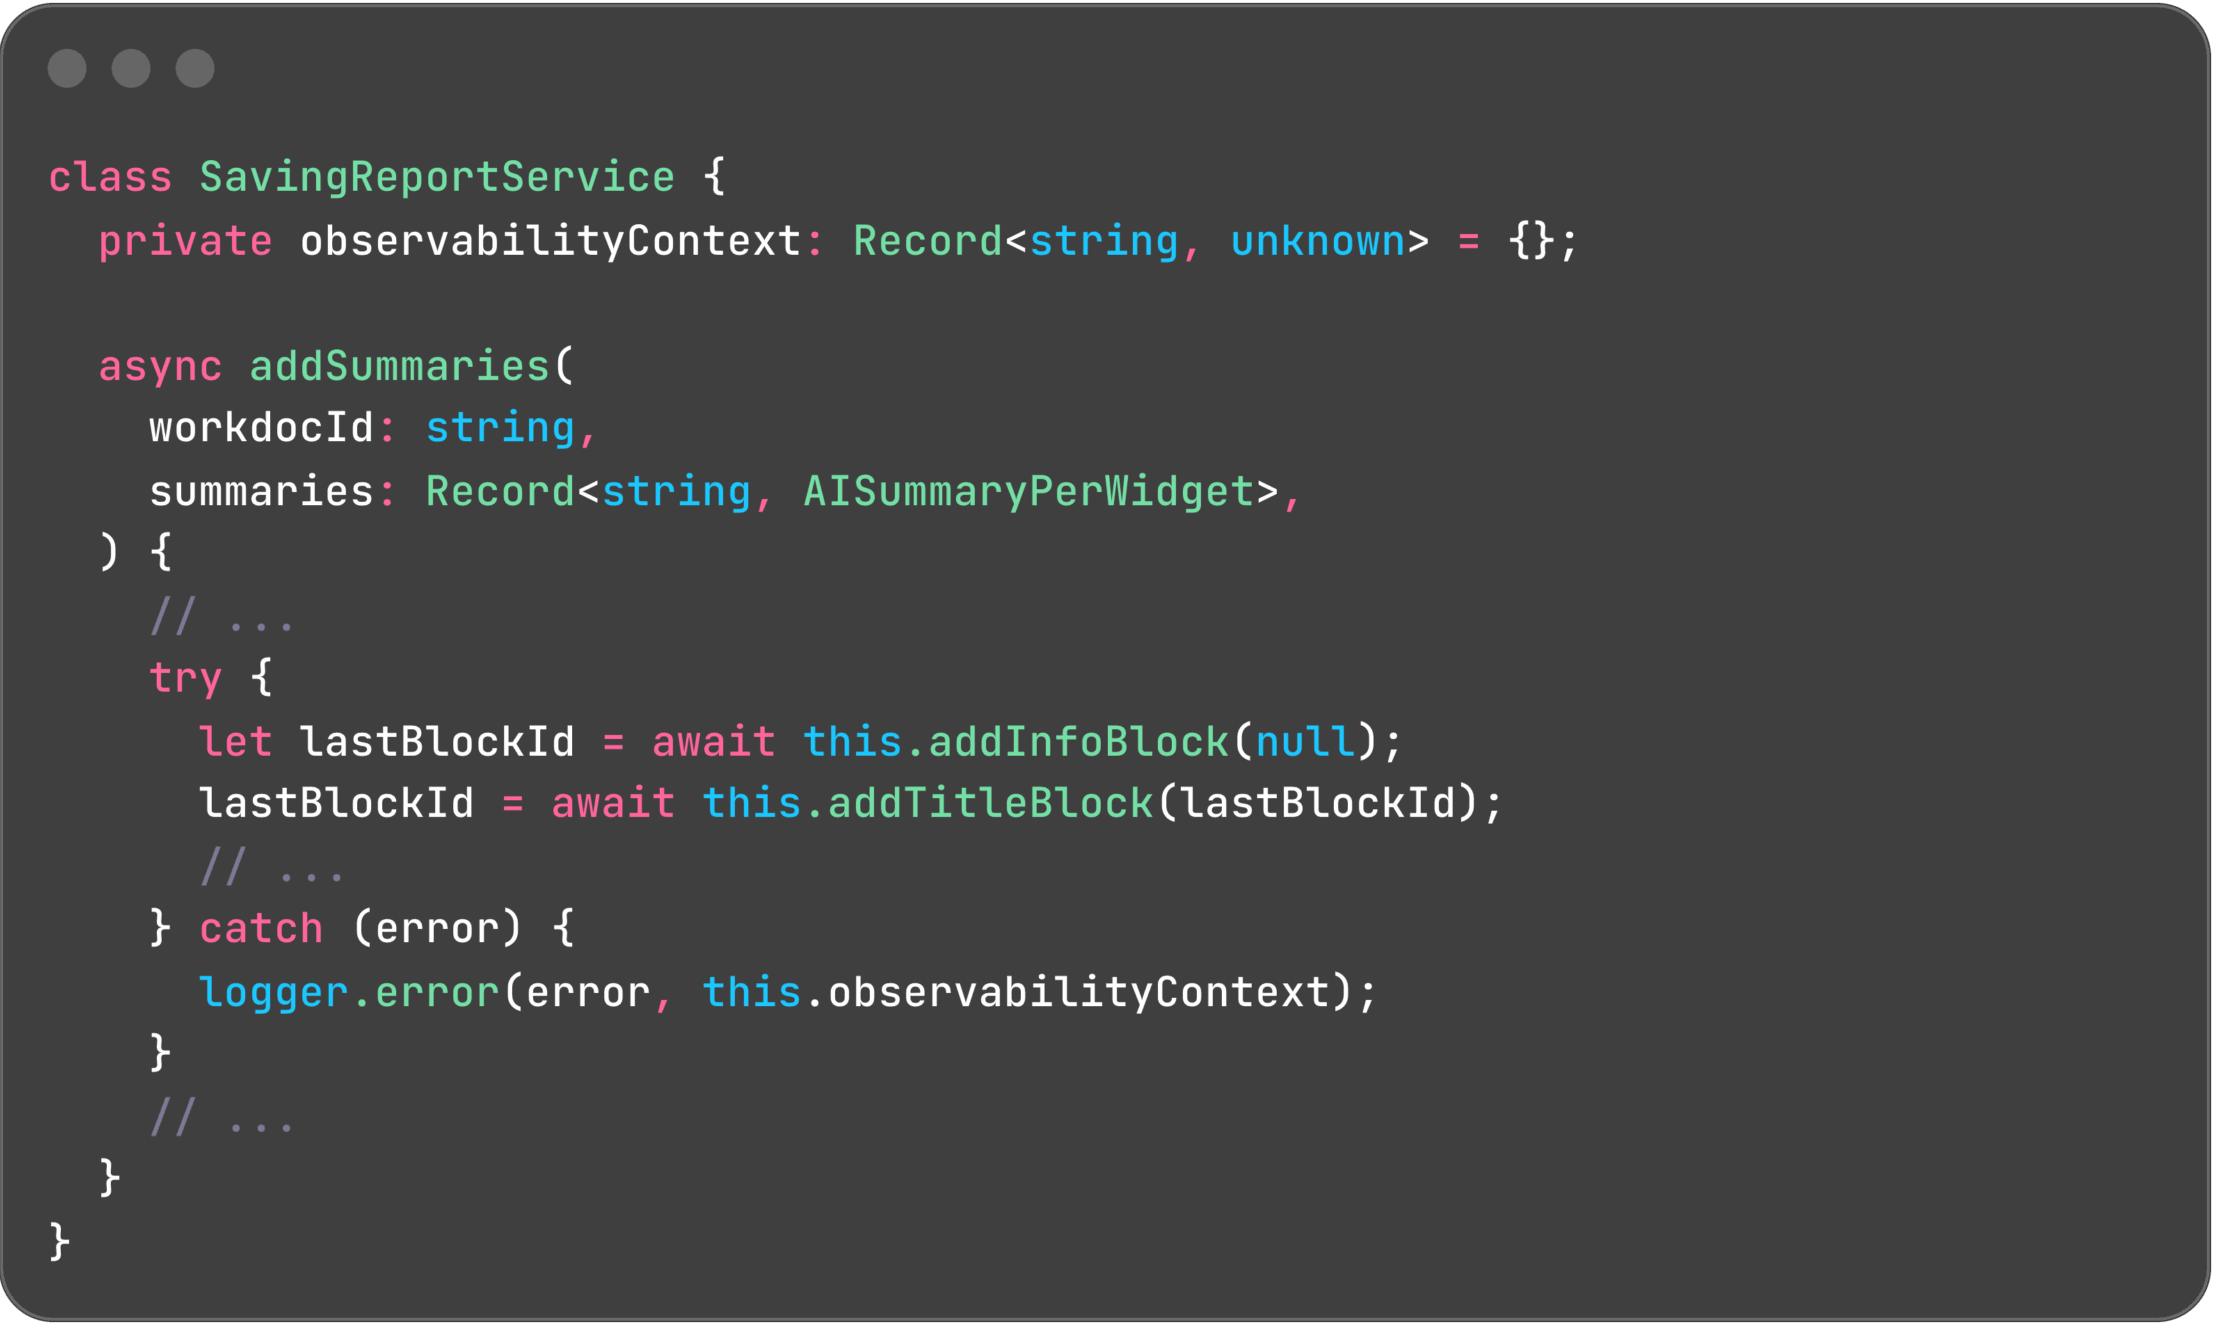
Hypothesis 1: Observability context is leaking
Our initial thought was that an incorrect context might be cached, leading to misleading logs. The SavingReportService carries an observabilityContext:
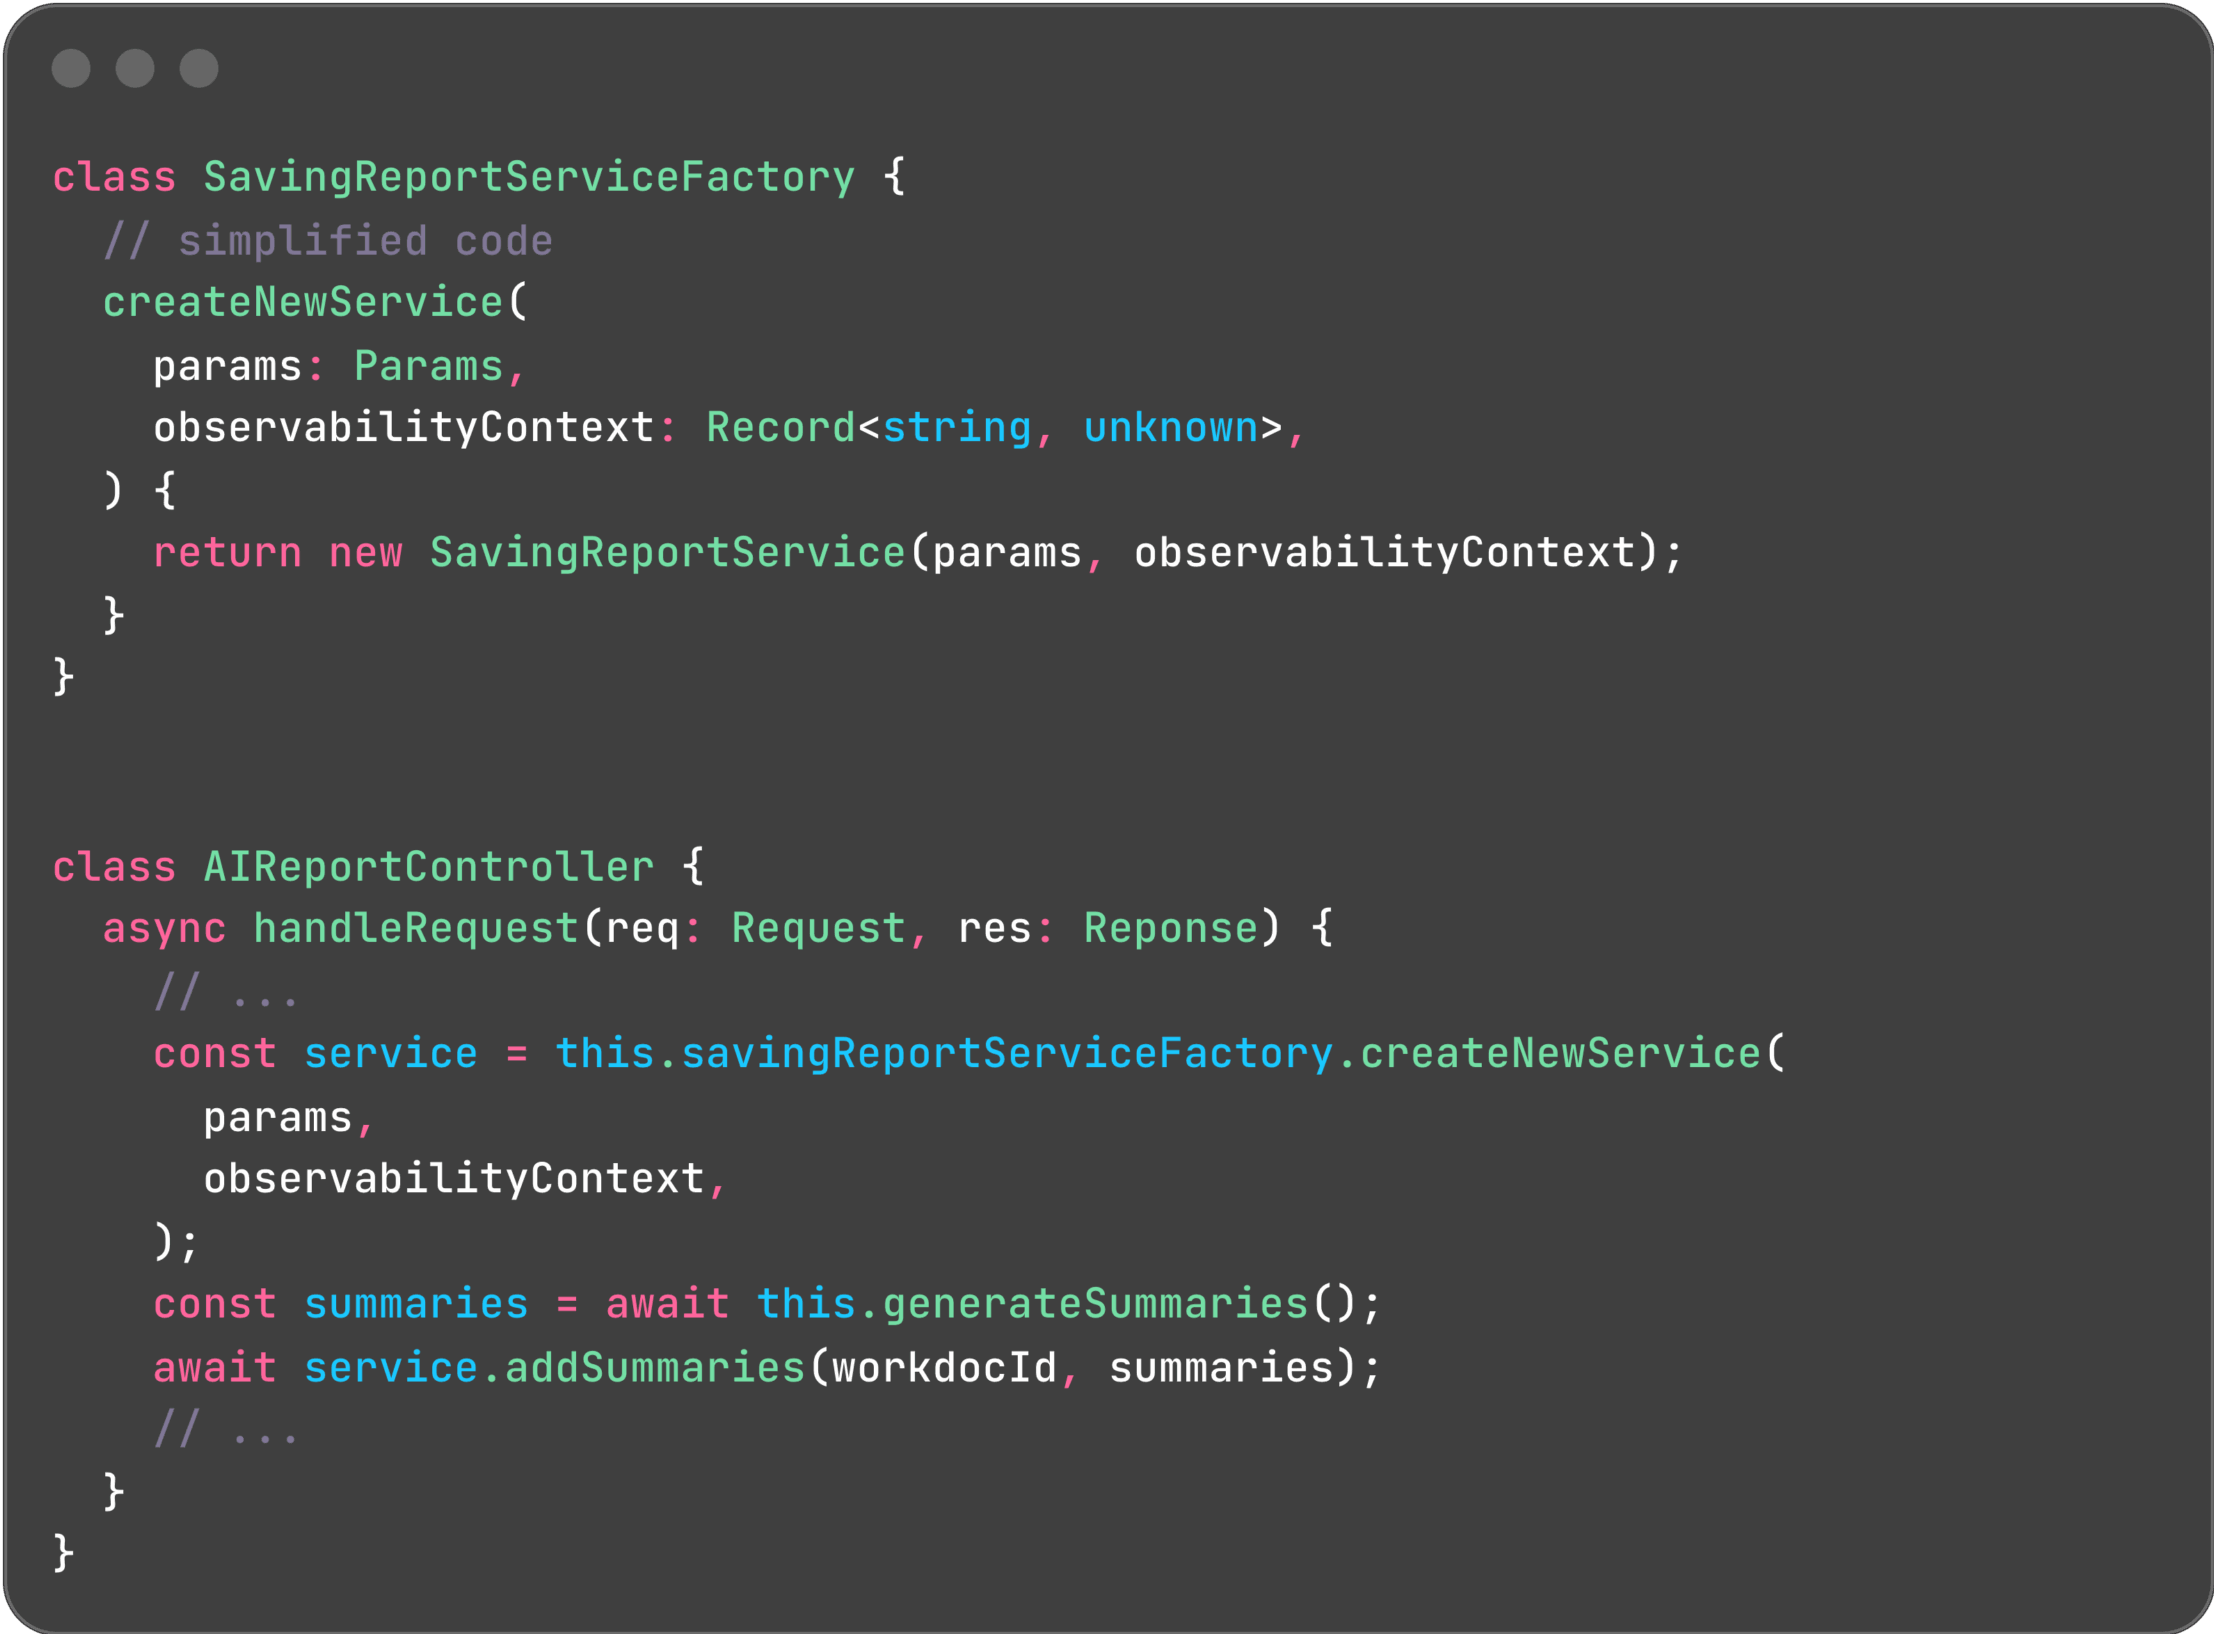
However, each request receives its own SavingReportService instance, created using a factory pattern. This design effectively rules out any context leakage:
Hypothesis 2: Corrupt lastBlockId
To ensure correct block order, we track the lastBlockId and include it in GraphQL requests, instructing the WorkDocs API to insert new blocks immediately after existing ones. The observed error in the logs would indeed occur if the specified block ID did not exist.
Yet, we verified that the block ID was updated correctly. Failed mutations were retried up to three times, with a fallback to the previous valid block if necessary. This hypothesis was also ruled out.
Aha! – A Hidden Singleton!
If per-request state was bleeding between requests without any apparent shared global state, then one of our classes had to be a singleton. Since SavingReportService was not the culprit, our attention shifted to WorkdocsAPIService.
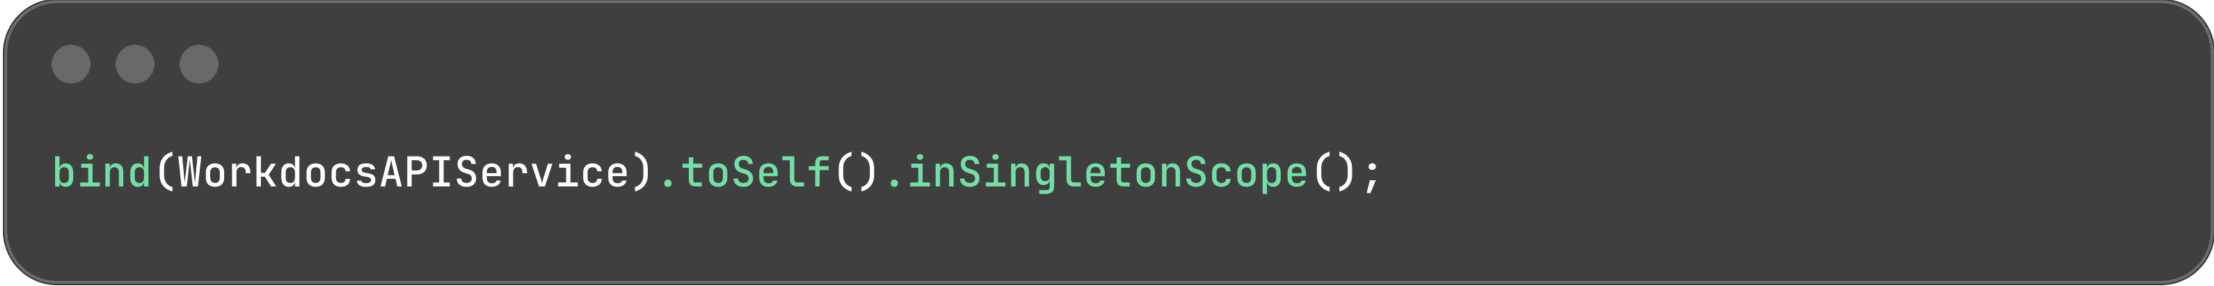
And there it was! We had indeed registered WorkdocsAPIService as a singleton, instructing the container to create a single instance of the class and inject that same instance whenever WorkdocsAPIService was requested.
This was a classic case of copy-and-paste gone awry. All other services in this module were stateless, making singleton registration perfectly logical. However, WorkdocsAPIService was not stateless, a subtle but critical distinction that had been overlooked.
The consequence? Every pod maintained exactly one WorkdocsAPIService instance, leading concurrent reports to inadvertently overwrite each other's workdocId.
Why Didn't We See This Sooner?
- Low Adoption: We only generate approximately 200 reports per day (up to 15-20 per hour), meaning the conditions for a race were rarely met in production.
- Numerous Pods: To facilitate faster delivery, we reused an existing microservice that scales to about 60 pods at peak. The probability of two concurrent reports landing on the same pod was tiny – until our load test aggressively slammed dozens of requests at once.
Takeaways
- Implement End-to-End (E2E) Tests that simulate at least two concurrent users hitting the same instance. This is crucial for uncovering shared state issues.
- Load Testing is Priceless: We aimed for headroom data but instead discovered and fixed a critical bug before users ever experienced it, preventing potential customer impact.
- Prefer Stateless Classes: Mutable state combined with asynchronous operations is a recipe for pain. While we cannot eliminate asynchronous operations, we can certainly eliminate hidden, mutable state.
Happy bug-hunting!