Why Go CPU Profiling on macOS Can Be Misleading
DoltHub discovered a critical Go CPU profiling flaw on macOS. Learn why macOS profiles mislead, the true bottleneck found with Ubuntu, its simple fix, and the underlying OS issue.
Dolt is pioneering the world's first version-controlled relational database, envision it as the offspring of MySQL and Git. Dolt empowers users to branch, fork, clone, merge, and diff their relational data with unparalleled flexibility.
Our team has been diligently optimizing Dolt to enhance its sysbench numbers, during which we uncovered some intriguing patterns in our performance profiles.
Profiling on macOS
Being written in Golang, Dolt leverages Go pprof, an invaluable tool for profiling Go programs and identifying performance bottlenecks. We conduct various benchmarks for different queries, but for this discussion, we'll focus on select_random_points. This benchmark executes SELECT id, k, c, pad FROM sbtest1 WHERE k IN (k1, k2, ..., k10), where k1, k2, ... represents a list of 10 random integers. This specific benchmark assesses Dolt's efficiency in utilizing indexes to traverse sections of our B-Tree (known as a Prolly Tree in our architecture) and retrieve individual rows.
As an M4 Mac user, my development environment produced the following flame graph from pprof:
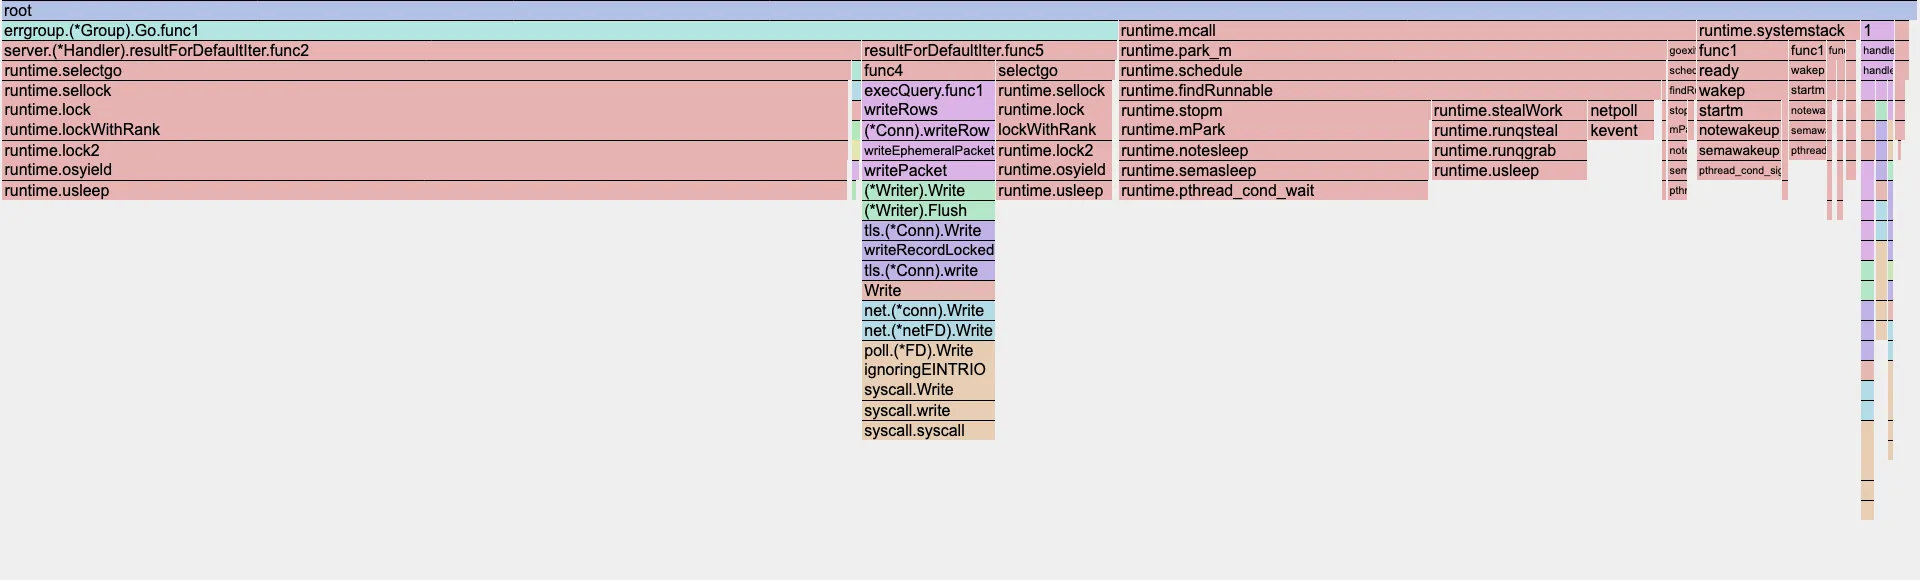
This graph strongly suggests that a significant portion of our CPU time is consumed by runtime.usleep, particularly within the resultForDefaultIter.func2 and resultForDefaultIter.func5 goroutines. These goroutines are responsible for reading rows from disk and sending them to the client. The top output from pprof further corroborates this observation:
(pprof) top
Showing nodes accounting for 43.56s, 98.33% of 44.30s total
Dropped 273 nodes (cum <= 0.22s)
Showing top 10 nodes out of 74
      flat  flat%   sum%        cum   cum%
    26.25s 59.26% 59.26%     26.25s 59.26%  runtime.usleep
     7.69s 17.36% 76.61%      7.69s 17.36%  runtime.pthread_cond_wait
     3.87s  8.74% 85.35%      3.87s  8.74%  syscall.syscall
     3.39s  7.65% 93.00%      3.39s  7.65%  runtime.pthread_cond_signal
     1.83s  4.13% 97.13%      1.83s  4.13%  runtime.kevent
     0.42s  0.95% 98.08%      0.42s  0.95%  runtime.pthread_kill
     0.08s  0.18% 98.26%      0.34s  0.77%  runtime.scanobject
     0.01s 0.023% 98.28%     19.89s 44.90%  github.com/dolthub/go-mysql-server/server.(*Handler).resultForDefaultIter.func2
     0.01s 0.023% 98.31%     13.25s 29.91%  runtime.findRunnable
     0.01s 0.023% 98.33%      3.67s  8.28%  runtime.stealWork
The profile unequivocally indicates that these goroutines spend a considerable amount of time in a waiting state.
Upon sharing my findings with a coworker, Aaron Son's astute observation resonated: "This don't make no sense!"
Profiling on Ubuntu
Aaron subsequently executed the identical benchmarks on an Ubuntu instance, yielding a remarkably different, yet far more intuitive, flame graph:
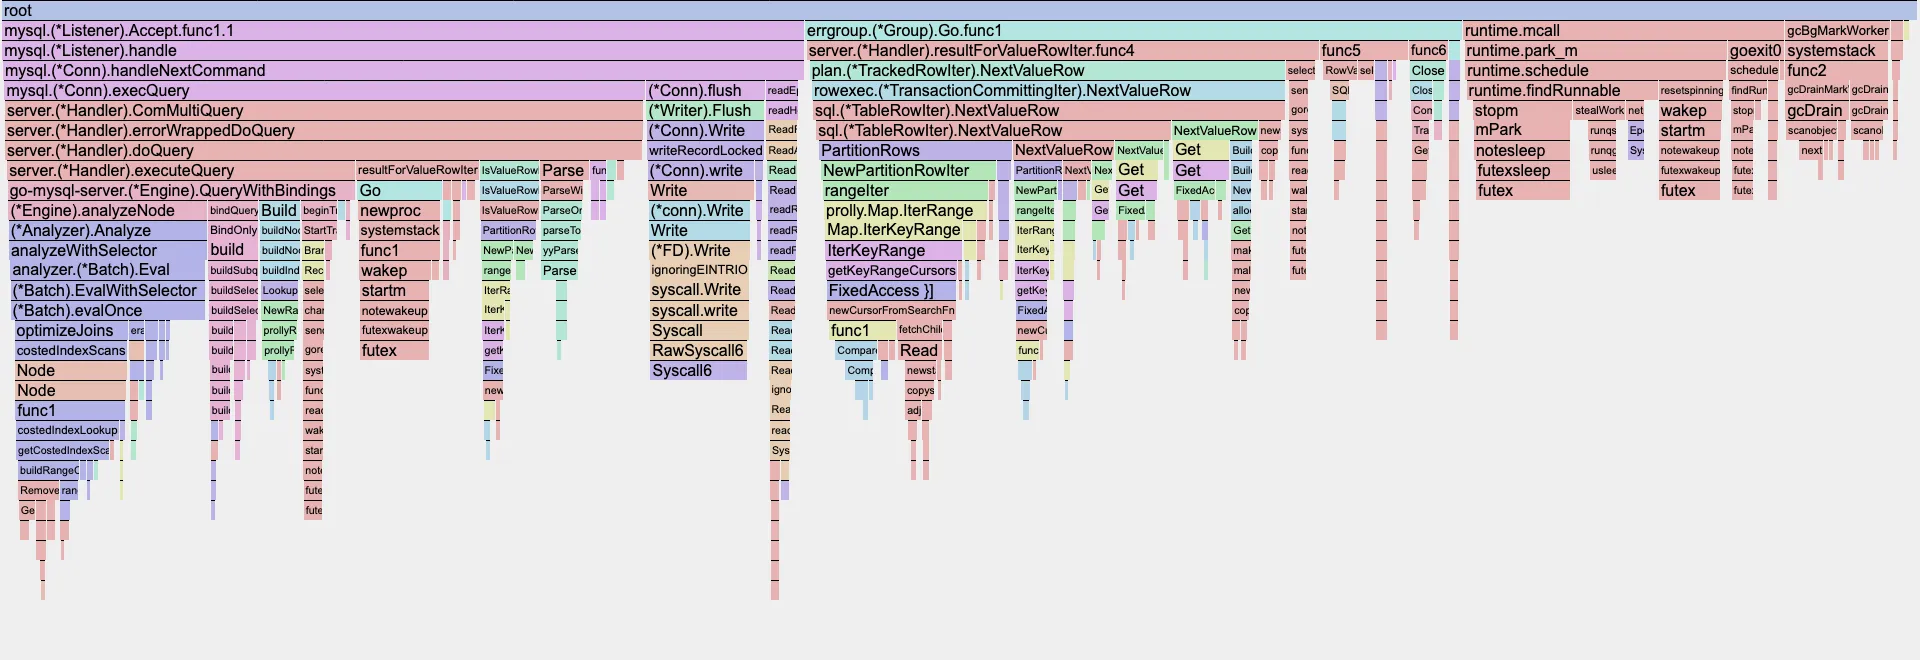
Here, the dominant blocks represent functions written by our team, rather than underlying Go runtime functions, which is a much more expected outcome. A glance at the top output clarifies this further:
(pprof) top
Showing nodes accounting for 53.06s, 36.85% of 143.98s total
Dropped 1531 nodes (cum <= 0.72s)
Showing top 10 nodes out of 280
      flat  flat%   sum%        cum   cum%
    24.81s 17.23% 17.23%     24.81s 17.23%  runtime.futex
     9.34s  6.49% 23.72%      9.34s  6.49%  internal/runtime/syscall.Syscall6
     4.99s  3.47% 27.18%      4.99s  3.47%  runtime.duffcopy
     2.49s  1.73% 28.91%      2.49s  1.73%  runtime.nextFreeFast
     2.20s  1.53% 30.44%      2.20s  1.53%  runtime.usleep
     1.91s  1.33% 31.77%      1.91s  1.33%  runtime.memclrNoHeapPointers
     1.90s  1.32% 33.09%      6.46s  4.49%  runtime.scanobject
     1.86s  1.29% 34.38%      2.45s  1.70%  runtime.typePointers.next
     1.82s  1.26% 35.64%      7.62s  5.29%  github.com/dolthub/dolt/go/store/val.TupleDesc.Compare
     1.74s  1.21% 36.85%      4.89s  3.40%  github.com/dolthub/dolt/go/store/val.DefaultTupleComparator.Compare
Beyond futex and syscall, the prominent entry here is runtime.duffcopy. This Go runtime function is dedicated to efficiently copying large blocks of memory. Further investigation revealed that during Prolly Tree traversal (among other functions), we were inadvertently passing val.TupleDesc and tree.Node by value. Given the relatively large size of these structs, this practice led to numerous unnecessary and costly memory copies.
The Fix
Fortunately, the solution was straightforward: simply prepending an asterisk (*) to val.TupleDesc and tree.Node to pass them by pointer instead of by value. This minor adjustment yielded notable performance improvements:
groupby_scan: 18.61 -> 14.73; -20.85%index_join: 2.57 -> 2.14; -16.73%select_random_points: 0.64 -> 0.61; -4.69%
The complete benchmark results can be reviewed in these pull request comments:
- https://github.com/dolthub/dolt/pull/10025#issuecomment-3487995157
- https://github.com/dolthub/dolt/pull/10029#issuecomment-3493529537
Clearly, eliminating these deep copies provided a significant performance boost.
Revisiting macOS
Did these newly identified bottlenecks manifest in the macOS profile? Applying a filter for runtime.duffcopy on the macOS profile reveals:
Active filters:
  focus=duffcopy
Showing nodes accounting for 0.09s, 0.2% of 44.30s total
Showing top 10 nodes out of 15
      flat  flat%   sum%        cum   cum%
     0.09s   0.2%   0.2%      0.09s   0.2%  runtime.duffcopy
         0     0%   0.2%      0.08s  0.18%  github.com/dolthub/dolt/go/libraries/doltcore/sqle/index.prollyIndexIter.Next
         0     0%   0.2%      0.03s 0.068%  github.com/dolthub/dolt/go/libraries/doltcore/sqle/index.prollyIndexIter.Next.func1
         0     0%   0.2%      0.03s 0.068%  github.com/dolthub/dolt/go/libraries/doltcore/sqle/index.prollyIndexIter.rowFromTuples
Had we relied solely on the macOS profile, it is highly improbable that we would have pinpointed this relatively simple yet impactful fix. The macOS profile barely registers runtime.duffcopy, illustrating its misleading nature.
This led us to question if we were the first or only ones to encounter such an issue. Gemini seemed to agree that something was amiss. Further investigation uncovered a closed GitHub issue and an active GitHub issue from 2023, both detailing similar discrepancies in profiling graphs.
It appears this isn't an inherent problem with Golang itself, but rather a long-standing issue associated with macOS. Specifically, there seems to be a bias in how macOS reports POSIX signals, leading to an over-attribution of CPU time to syscalls and various random threads.
Therefore, a public service announcement to all Golang developers working on macOS: do not fully trust your CPU pprof, especially when dealing with concurrency.
Conclusion
Moving forward, we will circumvent this issue by performing our CPU profiling on Ubuntu instances. At DoltHub, we are committed to continuously enhancing Dolt's compatibility, correctness, and performance. Over the years, Dolt has seen substantial performance improvements; evolving from being 8-70x slower than MySQL, to 2-4x slower, and now approaching parity at 1-1.1x slower. We encourage you to try Dolt yourself and, if you encounter any performance issues, please feel free to report them. If you simply wish to chat, join our Discord.